
Shopify Inc. (NYSE: SHOP) and Boeing Co. (NYSE: BA) are two stocks moving Wednesday.
Boeing shares are trading lower after the company reported worse-than-expected first-quarter EPS results. Shopify shares are trading higher after the company reported better-than-expected first-quarter EPS and sales results.
Below is a technical look at the charts.
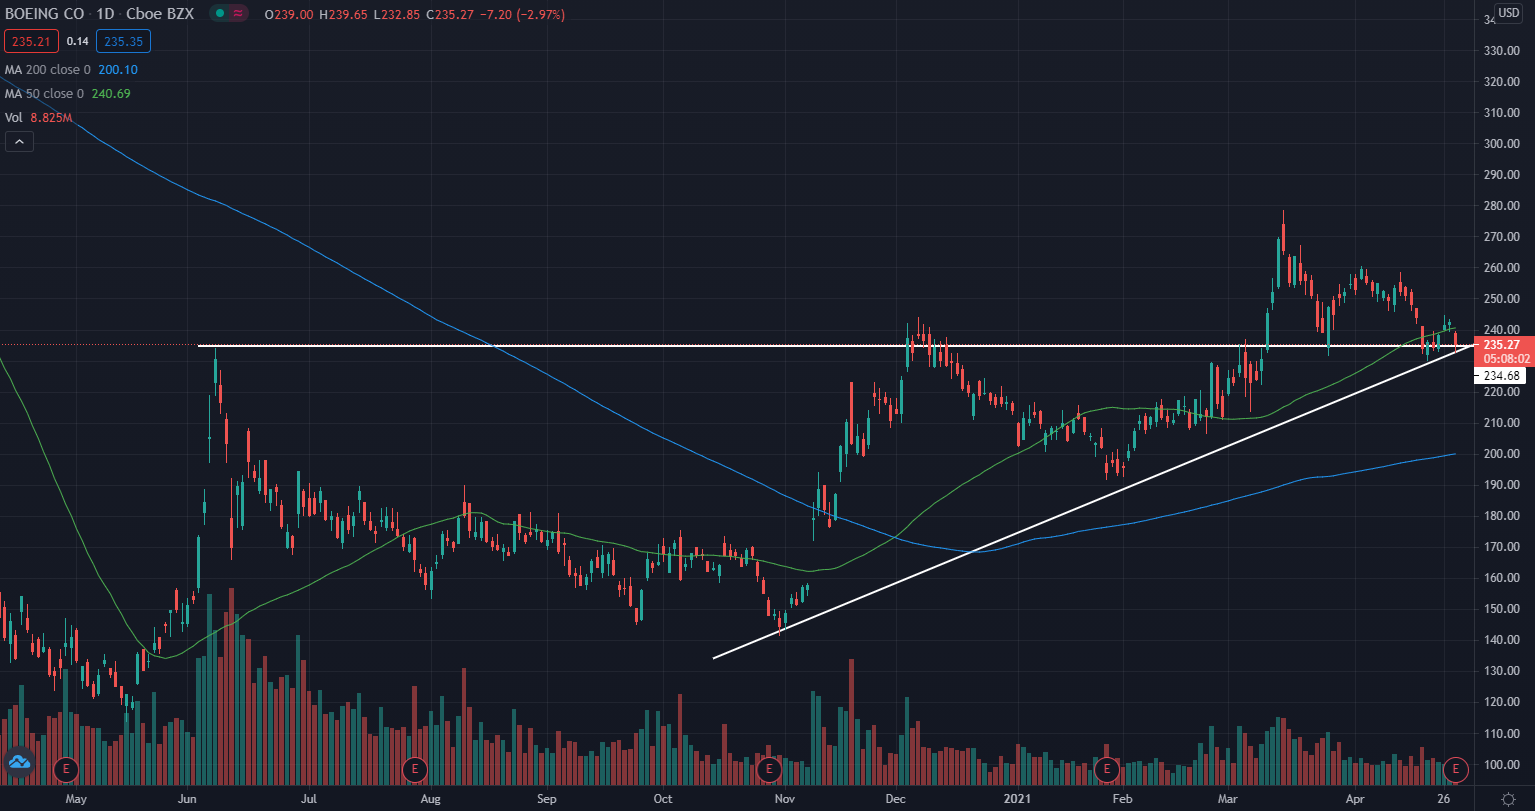
Boeing Daily Chart Analysis
- Boeing stock is looking to retest an old resistance area as support after breaking out of an ascending triangle pattern.
- The stock is trading below the 50-day moving average (green) and above the 200-day moving average (blue), indicating the stock is most likely facing a period of consolidation.
- The 50-day moving average may hold as a place of resistance on the chart and the 200-day moving average is a potential area of support.
Key Levels To Watch
- The stock held $235 as resistance in the past before breaking out above the level in March.
- This $235 was a resistance as the stock struggled to cross above this area. Now the stock needs to hold this area as support.
- If the $235 level is able to hold as support, and the price can consolidate above this level, then the price could see higher moves.
- The stock has also been forming higher lows throughout the previous six months and these higher lows may hold as support. A break below this higher low trendline could bring about a large drop-off in price.
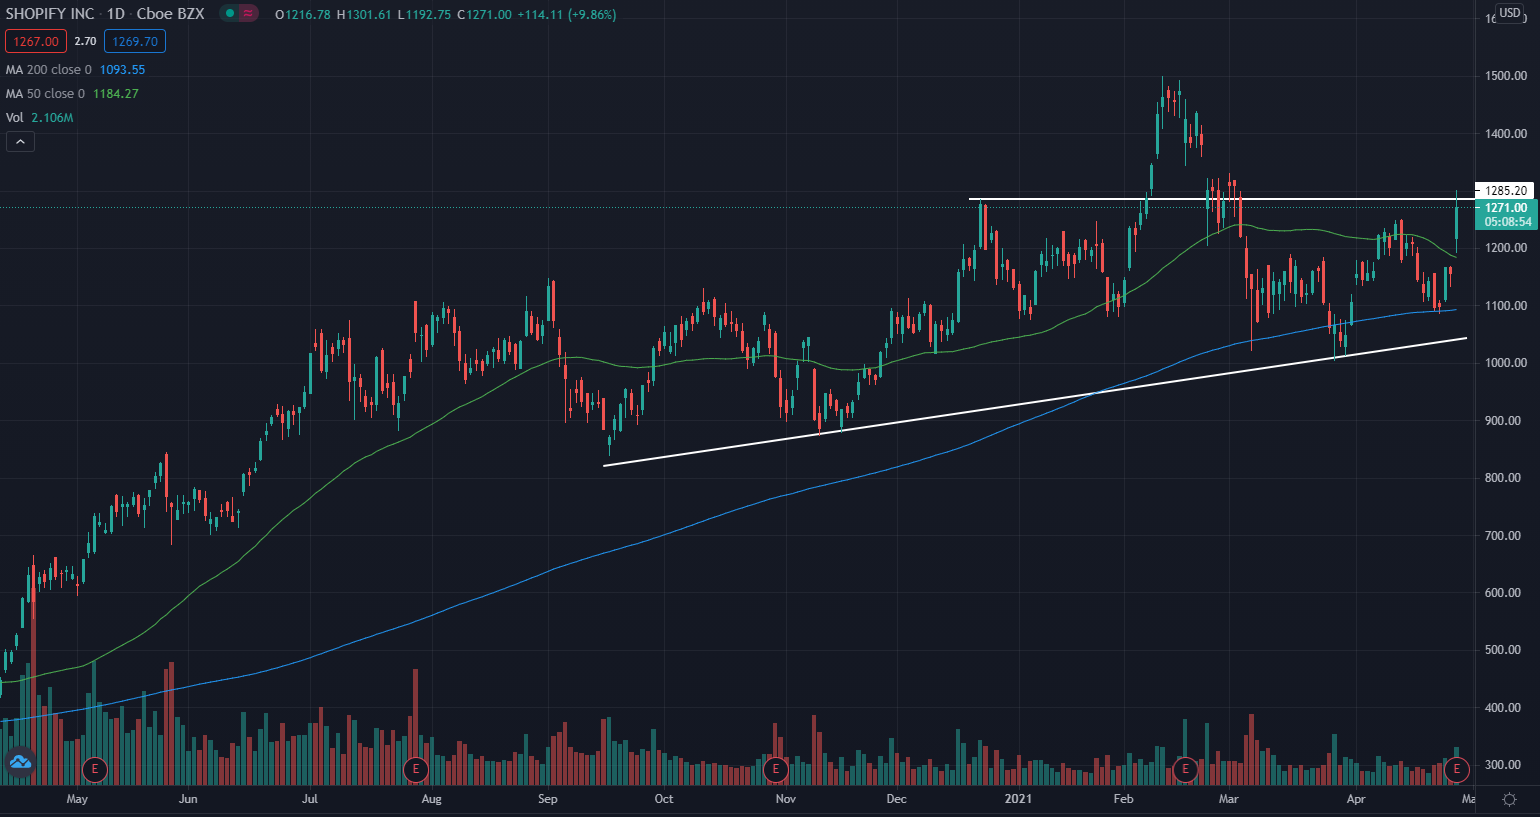
Shopify Daily Chart Analysis
- Shopify stock looks to be forming into what technical traders may call an ascending triangle pattern. The stock approached a key resistance near $1,285.
- The stock is trading above both the 50-day moving average (green) as well as the 200-day moving average (blue), indicating sentiment in the stock has been bullish recently.
- These moving averages may both hold as support levels in the future.
Key Levels To Watch
- The stock has been building higher lows throughout the year into an ascending triangle pattern.
- The ascending triangle shows a flat top resistance near the $1,285 level. The stock was able to cross above this level in February, but sellers were able to push the price back down.
- A break above flat top resistance with consolidation gives the stock a chance to push higher.
- A break below the higher lows may cause the overall trend to change.
(C) 2021 Benzinga.com. Benzinga does not provide investment advice. All rights reserved.