
(Wednesday Market Open) Welcome to the end of the quarter. While we’re still near record highs, it feels like a Missouri kind of market where investors are saying, “Show me” the news.
They may get some today when President Biden is expected to unveil an infrastructure program that could include tax hikes. That means it might get a muffled reaction from Wall Street, but it will be interesting to see which stocks are the beneficiaries. It could possibly help some of the Industrials. More below.
With the week half over thanks to Friday’s holiday, and Q1 wrapping up today, there’s not much sense of direction. Major indices spent the first two days of the week basically spinning their wheels and backing up slightly from Friday’s late rally. Things looked pretty flat in overnight trading, with the “horsemen of risk” including Treasury yields and volatility almost unchanged from yesterday.
Direction Signs Sought in “Strange” Week
The market’s still trying to figure out what the trade is, so to speak. Stay-at-home stocks were the trade for basically a year. Now, more people are getting vaccinated, but at the same time, you’re starting to see a rise in cases in many states. That’s kind of messy, and so is the market.
Maybe it will make more sense tomorrow when we get key jobs and manufacturing data, and on Friday when the March employment report comes out. Last night also brought a bit of news from the earnings front with lululemon (NASDAQ: LULU) and Chewy (NYSE: CHWY) reporting. Micron (NASDAQ: MU) earnings wait on deck after today’s close. Meanwhile, it’s possible we could get some “window dressing” toward the close, where major funds buy some of the stocks that performed well during Q1.
Remember, the market is closed Friday for the holiday, and we won’t be publishing our Daily Market Update, but will include analysis of the jobs report on Monday. Analysts expect the report to show March job creation of around 680,000. It’s a strange, strange week, with the employment report coming out while the market is closed. A quick look back shows this has happened at least once before, about a decade ago.
Stay-at-Home No More?
LULU kicked off this week’s earnings schedule late yesterday by beating analysts’ sales and earnings estimates and projecting strong sales guidance. The stock fell in pre-market trading, as the company’s full-year earnings outlook was a little below Wall Street’s expectations.
LULU’s press release used an optimistic baseball euphemism ahead of opening day, saying, “We are still in the early innings of our growth.” Maybe they’re thinking of how casual clothing might remain popular because many people could continue working from home at least part of the time even when the pandemic fades. The company is trying to attract male customers with some new shorts lines.
CHWY earnings got a better reception, with the stock jumping 11% in pre-market trading on really great results. The pet-food retailer reported positive earnings when analysts had expected a loss.
We talked yesterday about the so-called “pandemic puppy” trend where people bought pets because they were stuck at home. Well, the puppy boom appears to be paying off for CHWY. Those pets keep needing food and toys, so maybe CHWY isn’t simply a “stay-at-home” stock after all. If you want an analogy, think of the old “razor and blades” one, but in CHWY’s case the pet is the razor and the food and litter are the blades.
As noted above, Micron (MU) is expected to report after the close today. The company recently raised guidance, and sounded optimistic last time out about the dynamic random access memory chips (DRAM) market. Shares of the company have leveled off recently after a sizzling February. Even if you’re not an investor in MU or the chip sector, it might still be worth listening to the conference call to get a read on the semiconductor shortage from MU’s vantage point.
Checking SPX Technical Picture as Q1 Ends
From a technical standpoint, it seems a bit bearish that the S&P 500 Index (SPX) hasn’t been able to make any real sustained effort this week to punch through 4000 after ending so strongly last Friday not far from that level. It’s been two weeks since the last all-time high (3983), and Friday’s peak missed that by a few points. Lower highs can be another bearish signal, though you’d have to see a few more failures to really mark a trend.
That said, you can’t argue March wasn’t a good month for the SPX, as it rose nearly 4% heading into today’s final session. The same can’t be said for the Nasdaq 100 (NDX), which is down about half a percent since the end of February. It’s loaded with Tech companies, and that sector got smacked again yesterday as the same old story played out with higher yields taking a toll.
The 10-year yield is up about 32 basis points this month, or more than a point per session on average, and sits near 1.72% to start the day. Also, it has a very bullish technical chart of higher highs and higher lows pretty much since the start of 2021. From a chart standpoint, in any case, it’s hard to see things changing on a dime.
Basically, yields tell us that people are making big bets on a recovery of the U.S. economy, something we also see in the rapidly rising U.S. dollar and in yesterday’s grand slam of a Consumer Confidence report from the Conference Board (it jumped to its best level in a year). The U.S. Dollar Index ($DXY) is now at its highest point since last November, though it’s entering a seasonal period where it’s traditionally weaker. We’ll see if any seasonal trend has enough power to push the greenback down in April.
Is it Finally “Infrastructure Week?”
Pushing down the dollar might be a challenge considering the Biden administration plans to share its infrastructure plan today. The Industrial sector has quietly been having a great year, up 13% so far, helped by ideas that something might actually happen on infrastructure after years of talk about it by both parties.
The issue now is that the administration apparently wants to pay for more of the program with higher taxes instead of just borrowing, and that has a chance to eventually take a bite out of earnings. Media reports ahead of Biden’s speech say he’ll propose raising the corporate tax to 28% from the current 21%, partially to provide hundreds of billions to repair and construct highways, bridges, transit and rail service.
Electric vehicle infrastructure also would get funding, and so would broadband. There’s also spending proposed for affordable homes. Basically, a lot of industries might get something out of this, but it’s way too early to figure out exactly who and exactly by when. Obviously, the legislation would have to get through Congress.
It’s way too soon to talk about the tax impact in too much detail, but analysts do say if corporate taxes rise, it’s something to potentially worry about in 2022, not 2021. At this point, S&P Capital IQ consensus for 2022 earnings growth stands at a healthy 15.8%, down from huge projected 2021 growth of 21.5%. The 2022 number could be one to focus on. If tax hikes start to appear more likely, that could weigh on earnings potential.
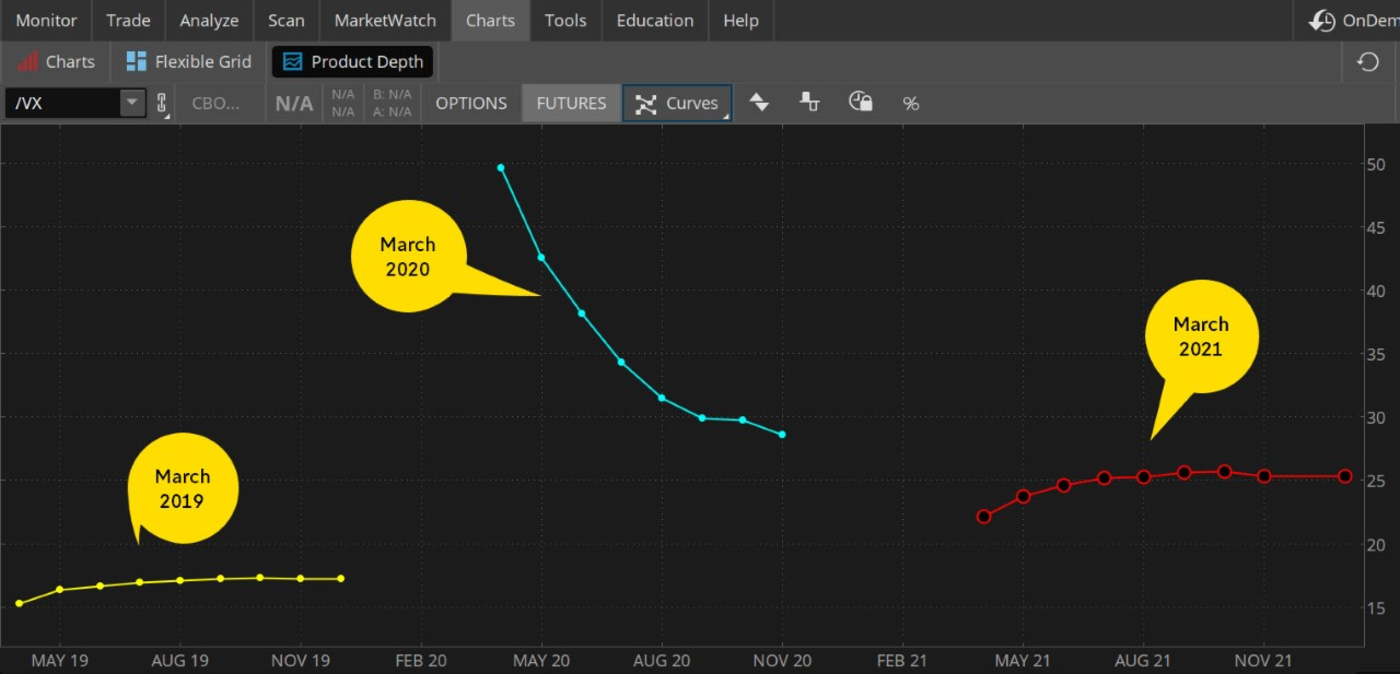
CHART OF THE DAY: VIX-O-LOGICAL JOURNEY THROUGH THE PAST COUPLE YEARS. Want a visual display of how much the volatility term structure has changed since March 2019? Two years ago (yellow line), the term structure of VIX futures (/VX) was typical for a low-volatility environment–slightly in contango and flat below 20. Last year at this time, we were at the height of the Covid scare, with the futures curve (blue line) in steep backwardation,with the front month above 50. This week (red line) we’re back to slight contango, but notice the curve is flat at a substantially higher level than it was two years ago. Is this a new volatility paradigm, or a sign that we’re still inching back toward normal? Data source: Cboe Global Markets. Chart source: The thinkorswim(R) platform. For illustrative purposes only. Past performance does not guarantee future results.
Data and More Data Ahead: If you like lots of economic data to guide your trading, the next few days will feel like a summer picnic with a full basket. Tomorrow brings two key reports: Weekly initial jobless claims and March ISM manufacturing. We discussed manufacturing yesterday–the short answer is that it’s been running hot ever since last spring’s downturn–while jobless claims fell last week to a post-pandemic low under 700,000.
Wall Street estimates for tomorrow’s headline claims number average 696,000, according to Briefing.com, up a bit from 684,000 the previous week. It would be good to see two weeks in a row below 700,000, but what’s really surprising is just how stubborn this data point continues to be. Remember, it went years before the pandemic without topping 300,000 in any week. It’s the continued stickiness of these high claims, among other data, that may be a big reason why the Fed continues to warn that we’re a long way from emerging out of the COVID storm battering the economy.
Million-Job March? Of course, when you talk about weekly jobless claims the obvious next topic is the monthly payrolls report. The next one is coming right up this Friday, though the market is closed that day for the holiday. Futures trading will take place, but really the first major chance for a full market reaction comes next Monday morning. Volume might be pretty strong to start next week after traders have all weekend to digest the data.
The average analyst estimate for March jobs growth is 679,000, according to Briefing.com. That would be a very nice lift from 379,000 in February, and some analysts expect an even better number. Could we hit seven-figure monthly job creation? According to some on Wall Street, the answer is a firm “maybe.” They expect heavy job growth in the reopening industries like restaurants, hotels and entertainment. Also, don’t forget that February jobs growth might have been stalled a bit by the winter storms in Texas, meaning some new positions that would have been created in February got pushed into March instead. Maybe.
Another Look at Technical Picture, VIX: Getting back to technical aspects for a moment, research firm CFRA says the bias remains bullish above 3843 for the SPX, and calls that a major support point. Breaking through resistance at 13,301 would be positive for the NDX, CFRA added. Volatility took another step lower Tuesday, with the Cboe Volatility Index (VIX) heading back below 20 after popping above 21 on Monday. It seems to be in a bit of a short-term trading range here roughly between 18 and 22. For more on the VIX, see the chart above.
TD Ameritrade(R) commentary for educational purposes only. Member SIPC.
(C) 2021 Benzinga.com. Benzinga does not provide investment advice. All rights reserved.