- Binance Coin price is contained inside an ascending triangle pattern on the 4-hour chart.
- The digital asset only needs to crack one key resistance level before a massive 30% upswing.
- The number of large BNB holders continues to greatly increase.
Binance Coin price is on the verge of a new all-time high again, rallying alongside CAKE. The Ethereum rival only faces one critical resistance level and the number of large holders continues to rise.
On the 4-hour chart, Binance Coin has formed an ascending triangle pattern which can be drawn using a horizontal trend line and an ascending trend line connecting the higher lows where both lines converge.
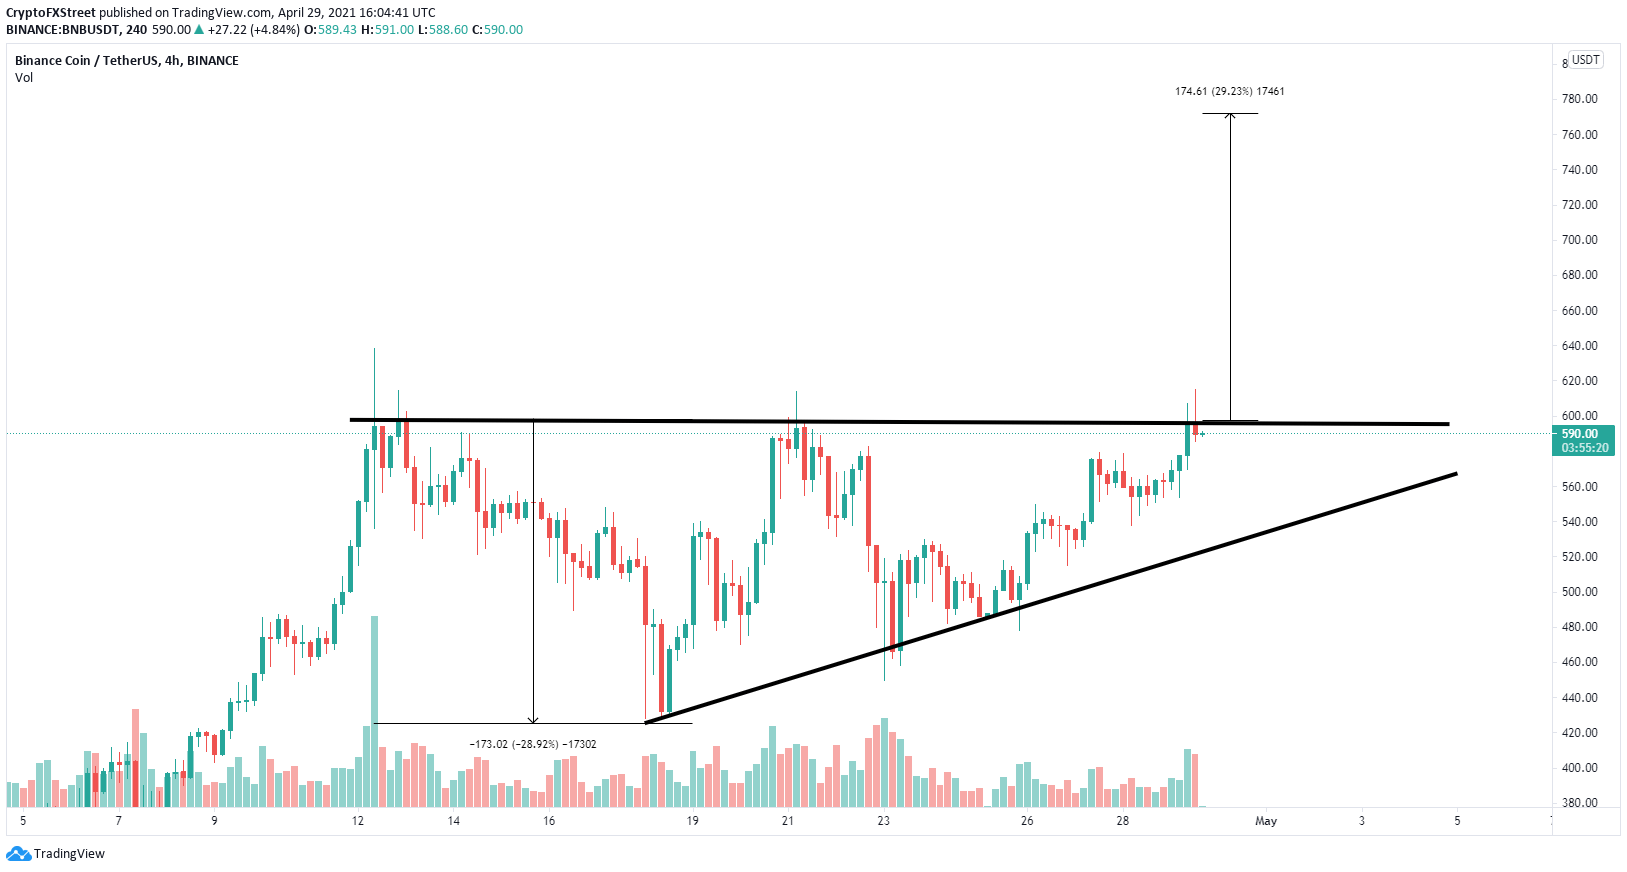
BNB/USD 4-hour chart
The upper boundary is located at the $600 psychological level. A breakout above this point has a long-term price target of $770. The only resistance in-between is the previous all-time high of $638.5 and $700.
%20[20.18.44,%2029%20Apr,%202021]-637553107356161652.png)
BNB Supply Distribution
Additionally, the number of whales holding between 10,000 and 100,000 BNB has significantly risen in the last two months from a low of 112 to a current high of 149. Similarly, the number of large holders with 1,000 and 10,000 also a significant spike from 700 to 819.
This indicates that holders remain extremely interesting in Binance Coin despite rising prices.
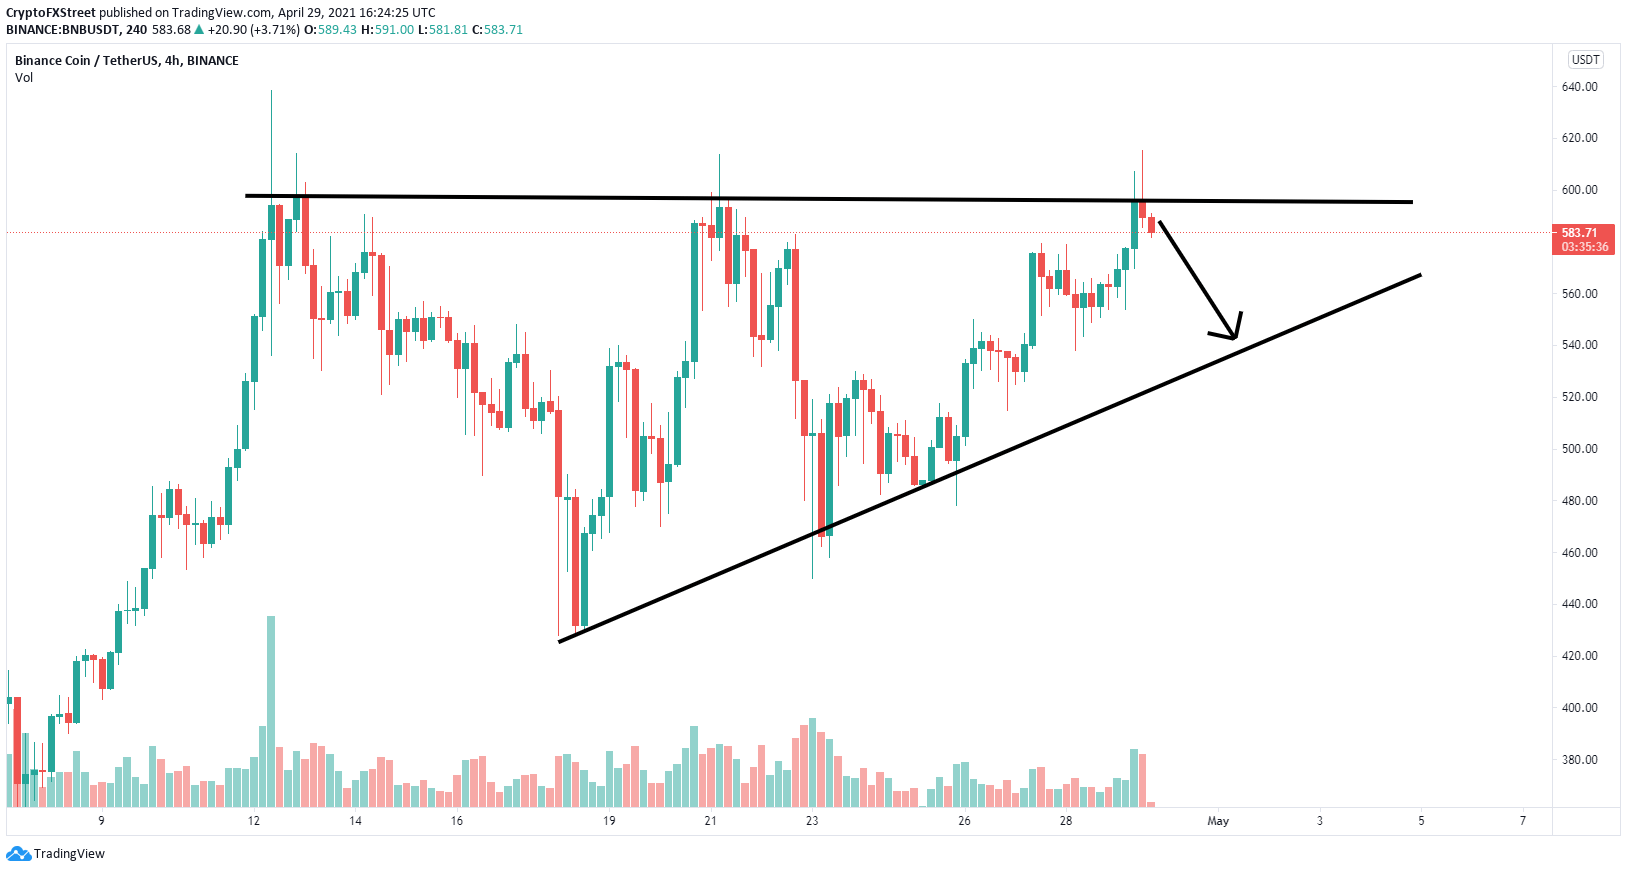
BNB/USD 4-hour chart
However, a rejection from the upper barrier at $600 will quickly drive BNB down to the lower trend line of the pattern at $540.