- Bitcoin price to receive a boost as CME plans to launch Micro BTC Futures on May 3.
- Unsurprisingly, the SEC delayed its decision on the Bitcoin ETF by extending the deadline up to June 17.
- BTC shows ambiguity as it could rise to a new all-time high or suffer a steep correction.
Bitcoin price shows considerable strength after springing from the recent crashes. Still, it is uncertain whether the current bullish impulse will morph into a new uptrend or lead to a more profound decline.
Even though the past week saw blood in the markets, things seem to have calmed down as Bitcoin appears to have found its footing.
Chicago Mercantile Exchange (CME) announced the launch of Micro Bitcoin Futures (MBT) on May 3, which could see a spike in interest from retail investors.
According to the firm’s senior managing director, Sean Tully, the decision to launch this new financial product comes after the company netted $4.70 million in revenues from its offering of Bitcoin Futures contracts in the first quarter of 2021. Now CME expects that the MBT would appeal to a broader audience due to its relatively smaller lot sizing and fee structure.
On the other end of the spectrum, the US Securities and Exchange Commission (SEC) gave itself an extension for deciding on VanEck’s Bitcoin ETF. The accelerated institutional demand could play a vital role in whether it would be approved or not.
The order published on April 28 reads,
… pursuant to Section 19(b)(2) of the Act,6 the Commission designates June 17, 2021, as the date by which the Commission shall either approve or disapprove, or institute proceedings to determine whether to disapprove, the proposed rule change…
While US regulators continue evaluating the approval of a Bitcoin ETF, institutions continue accumulating more Bitcoin. Nexon became the latest publicly listed firm to acquire BTC.
The Tokyo-based gaming company purchased $100 million worth of Bitcoin at an average price of $58,266, joining Telsa, MicroStrategy and others.
Bitcoin price has dipped to $47,000 on April 25 but has swiftly regained the losses incurred and now sits at an inflection point. Indeed, it could very well kick-start another rally that takes out the current highs as Ethereum has, or it might be the start of a much steeper correction.
The weekly chart puts the flash crash in perspective and shows that the downward impulse pushed BTC price into the early March territory but failed to test the 21-week Exponential Moving Average (EMA) at $44,996. Had this level been tapped, the bullish scenario would have been acceptable.
During the previous bull runs, BTC bounced off this EMA as it continued its parabolic growth. Hence, investors could get to see Bitcoin price come to such a crucial support level this time around. But for that to happen, a decisive daily candlestick close below the 100-day Simple Moving Average (SMA) at $50,655 must occur. Although the 21-week EMA could keep falling prices at bay, failing to hold above it would likely lead to a downswing to the 200-day SMA at $36,022.
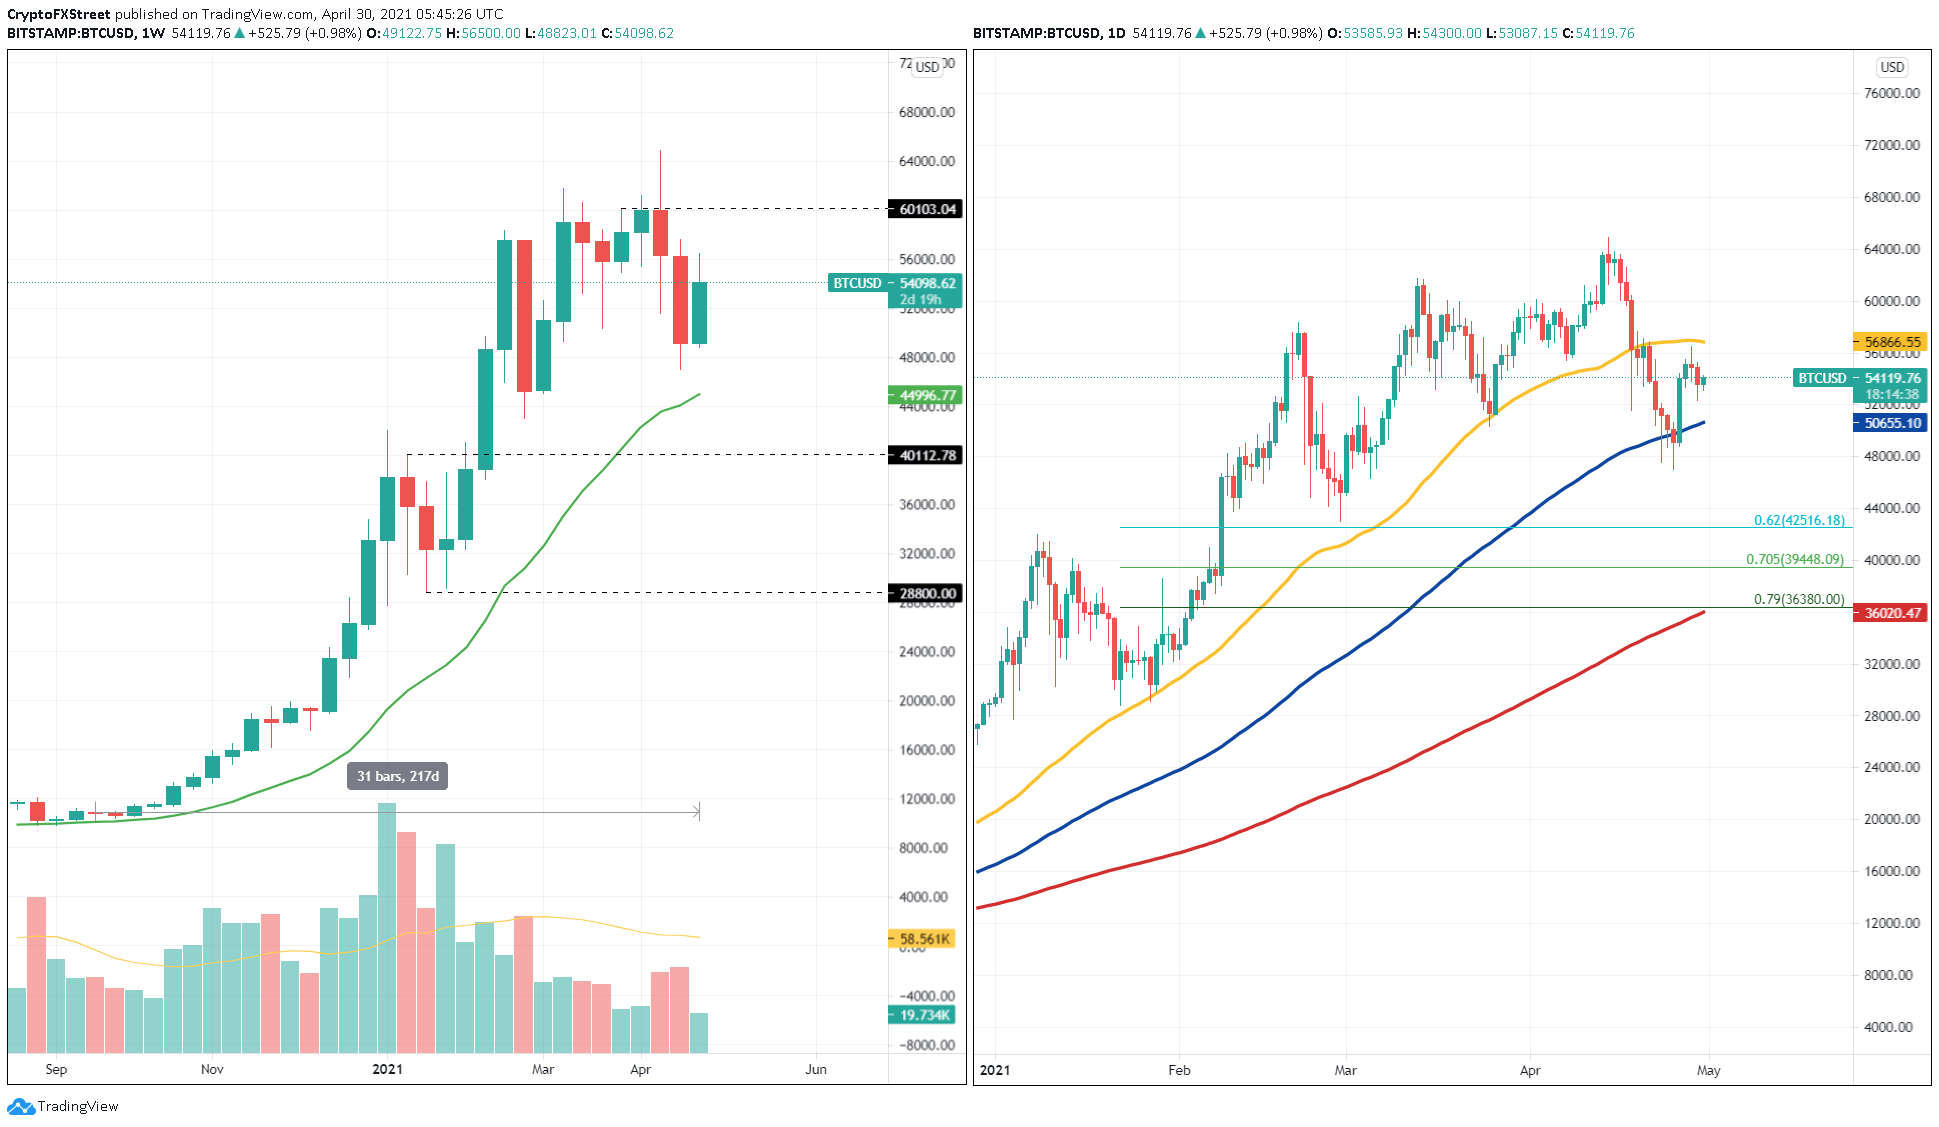
BTC/USD 1-week. 1-day chart
Dave The Wave, a renowned technical analyst in the cryptocurrency community, believes that the bearish carries a lot of weight. According to the chartist, the current bullish cycle resembled the one in 2017. When considering the recent price action and the evolution of the Moving Average Convergence Divergence (MACD) indicator, a steep correction could unfold.
Dave clarified that “a solid correction does not entail a multi-year bear market,” but it may be needed to maintain Bitcoin’s uptrend healthy.
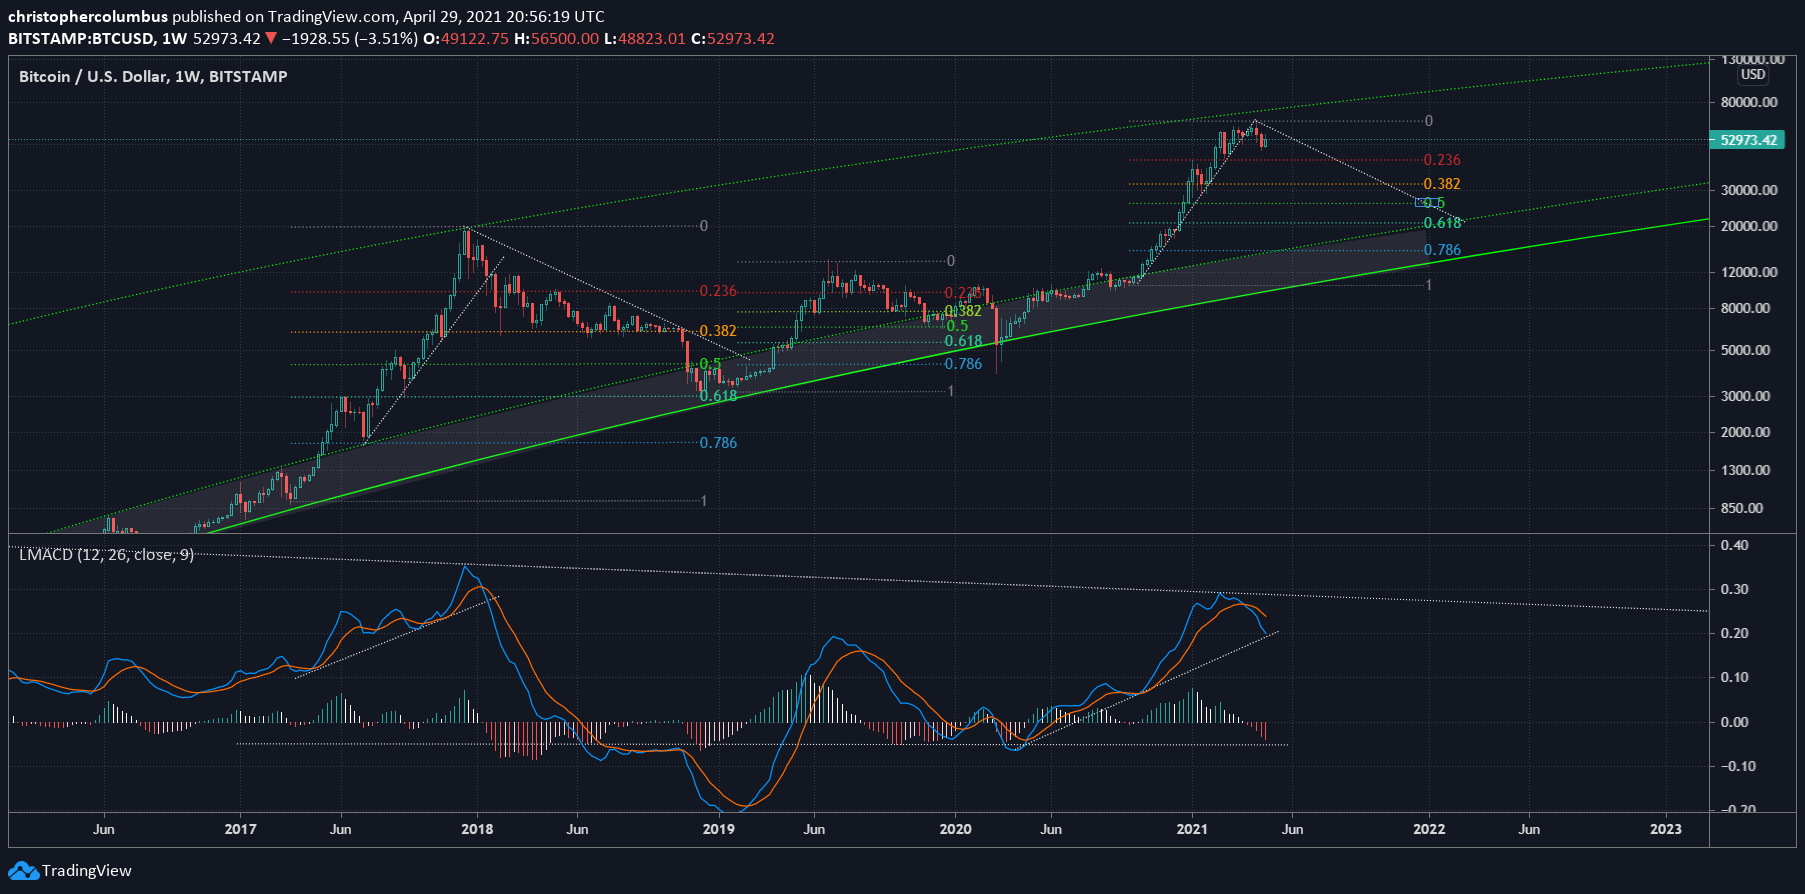
BTC/USD 1-week chart
Several on-chain metrics support that a steeper correction is underway.
For instance, the number of daily active addresses interacting with the Bitcoin network has been steadily declining over the past few weeks. It went from 1.10 million daily active addresses to roughly 1.05 million, representing a 4.50% drop.
Such on-chain activity suggests that investors could either be booking profits or reallocating their funds, which is a bearish sign.
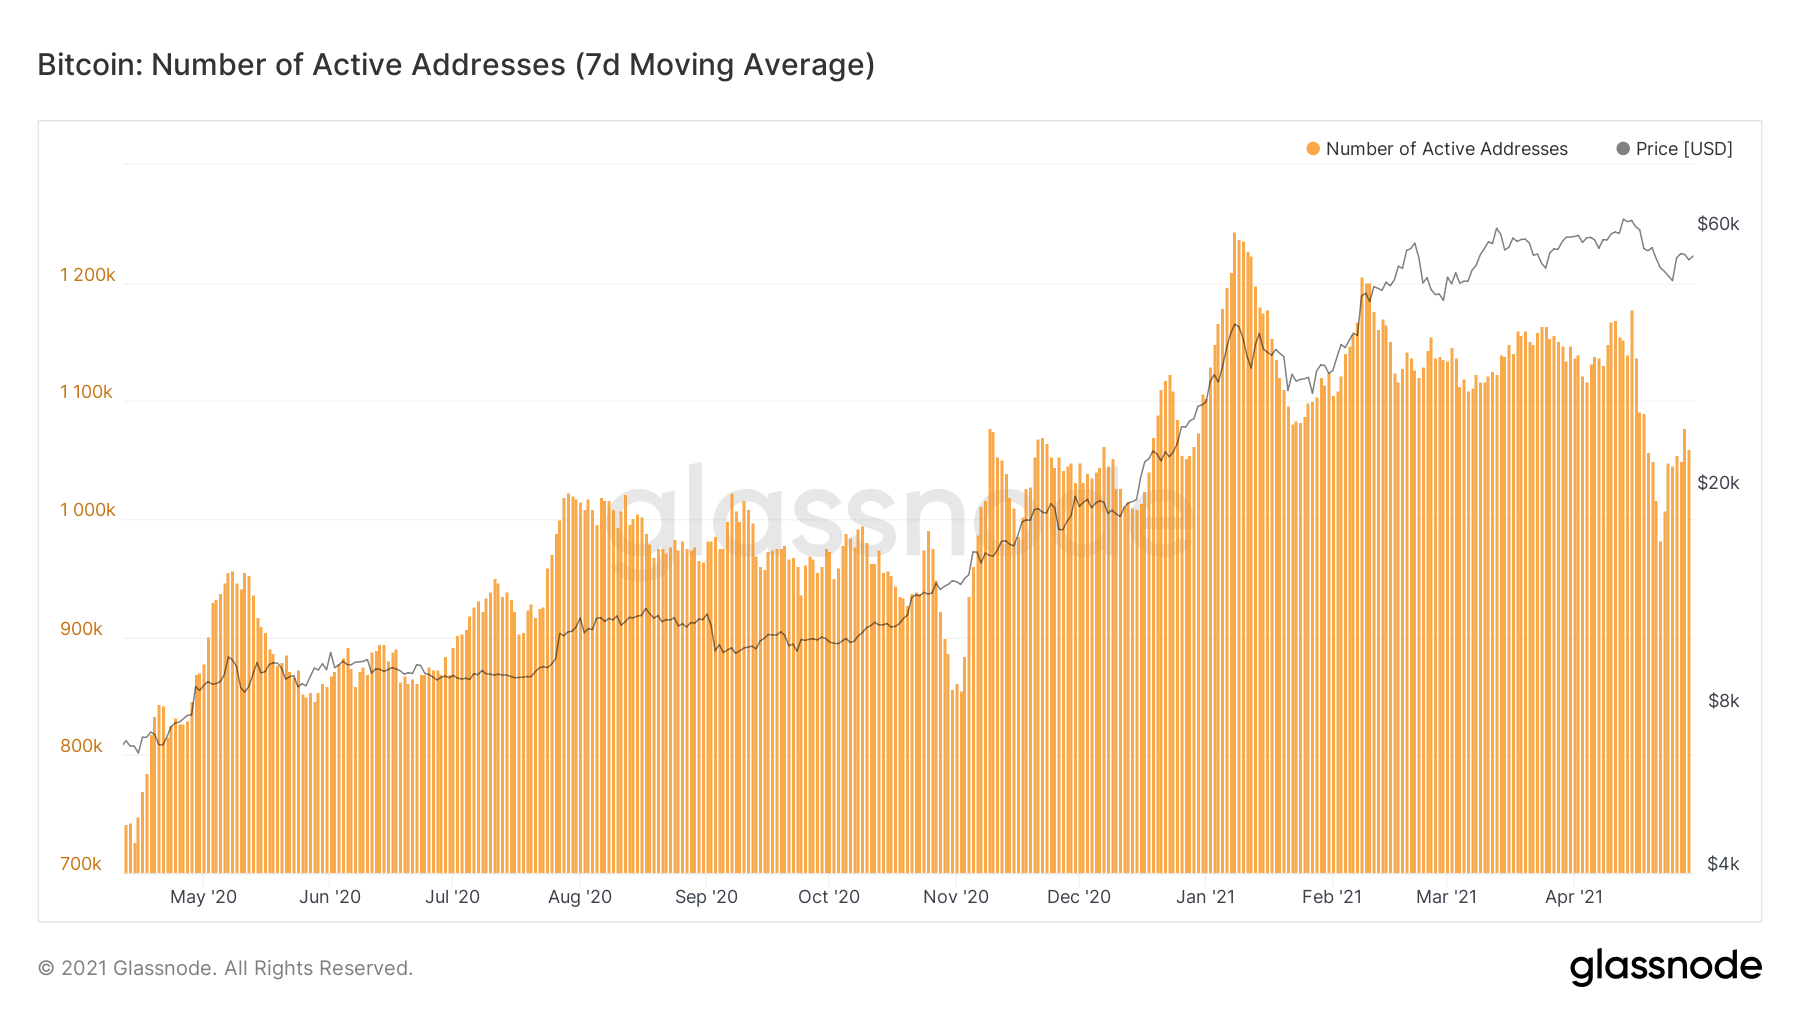
BTC daily active addresses chart
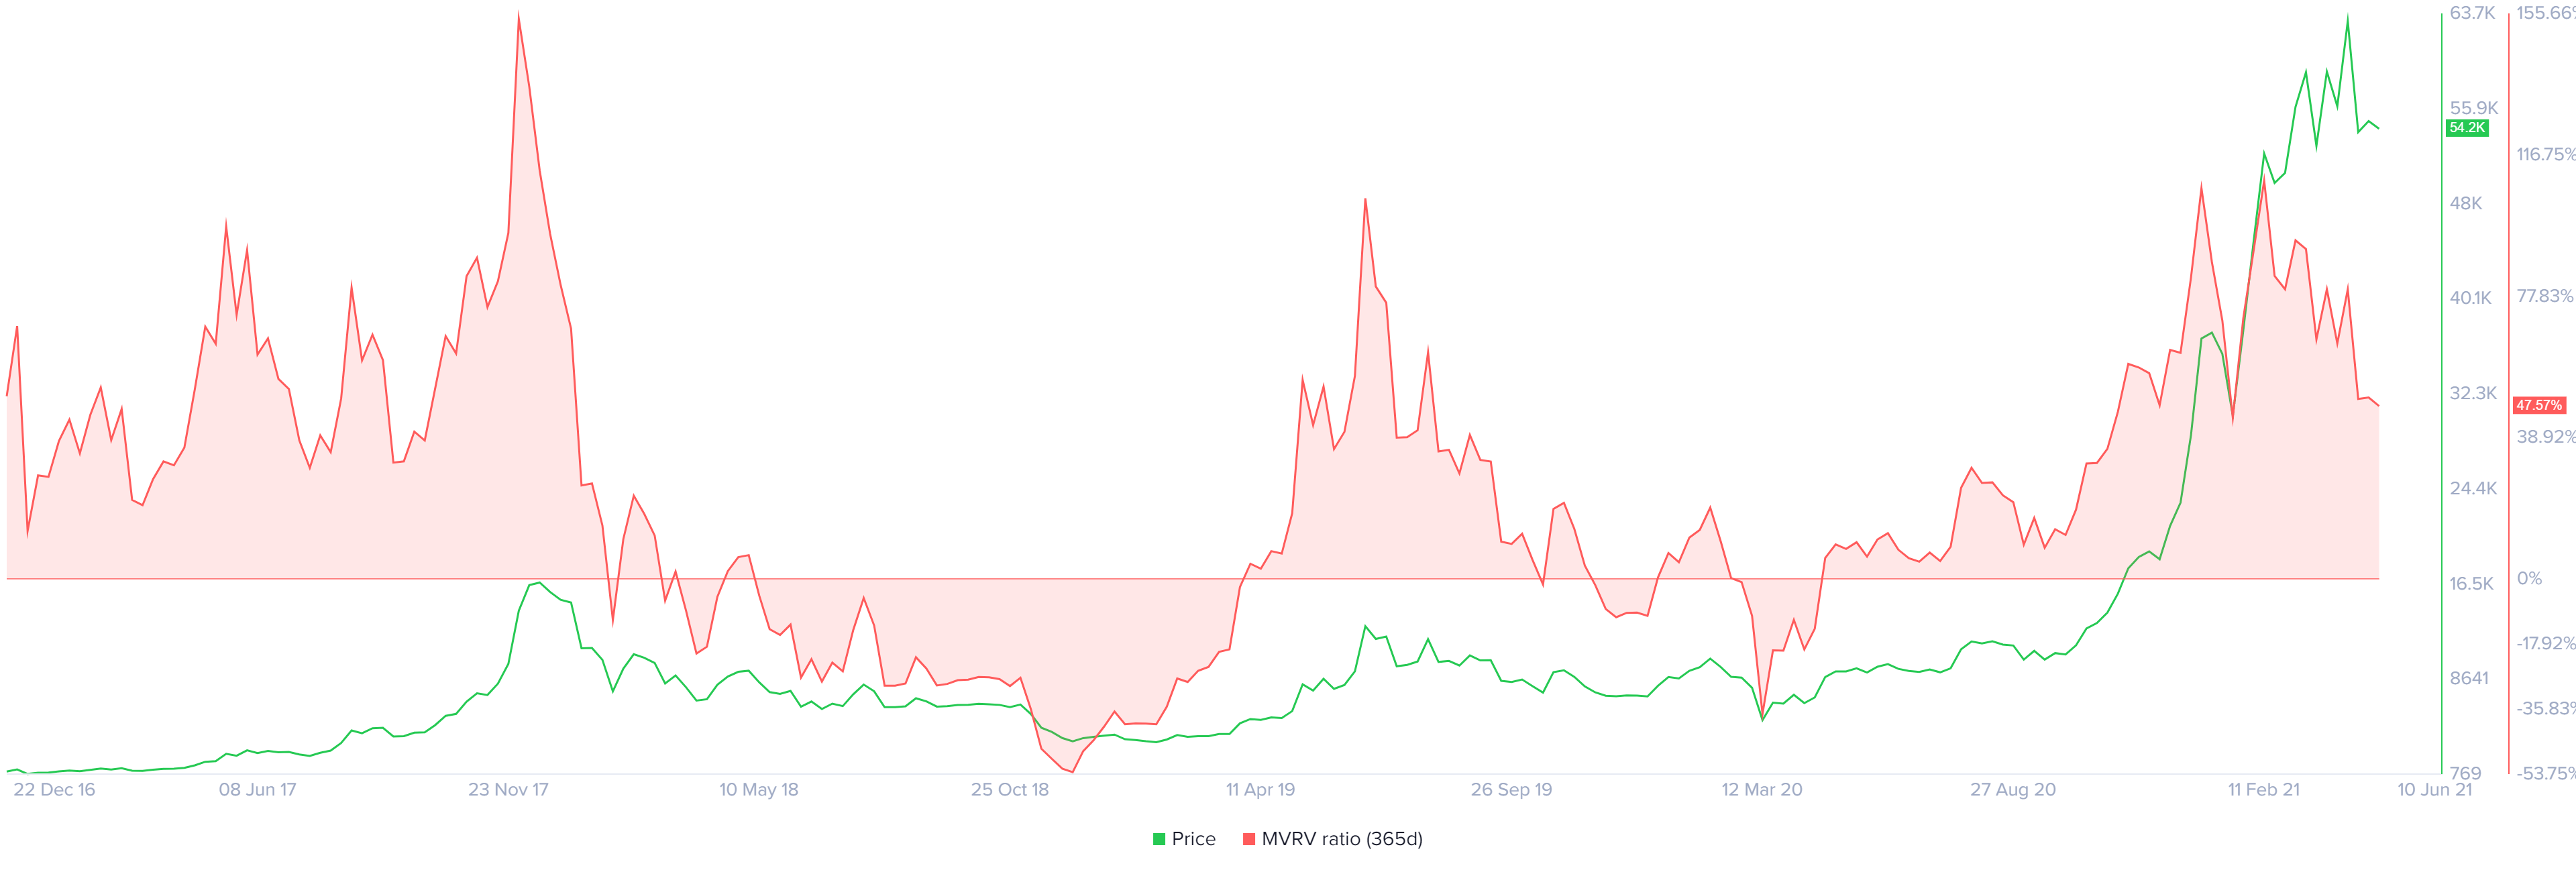
Moreover, Bitcoin’s 365-day MVRV reveals that most of the BTC tokens purchased over the past year sit 50% higher than at the time they were acquired. The high levels of profit that investors could incur now if they were to sell, indicate that a potential spike in profit-taking is underway.
Interestingly, the recent peak seen in the 365-day MVRV coincides with the high of late June 2019, which marked a local top at the time. Similar market reaction to this on-chain metric could see Bitcoin correct to at least the 21-week EMA at $44,996.
BTC 365-day MVRV chart
Despite the grim worst-case scenario, whales continue accumulating more Bitcoin at every dip.
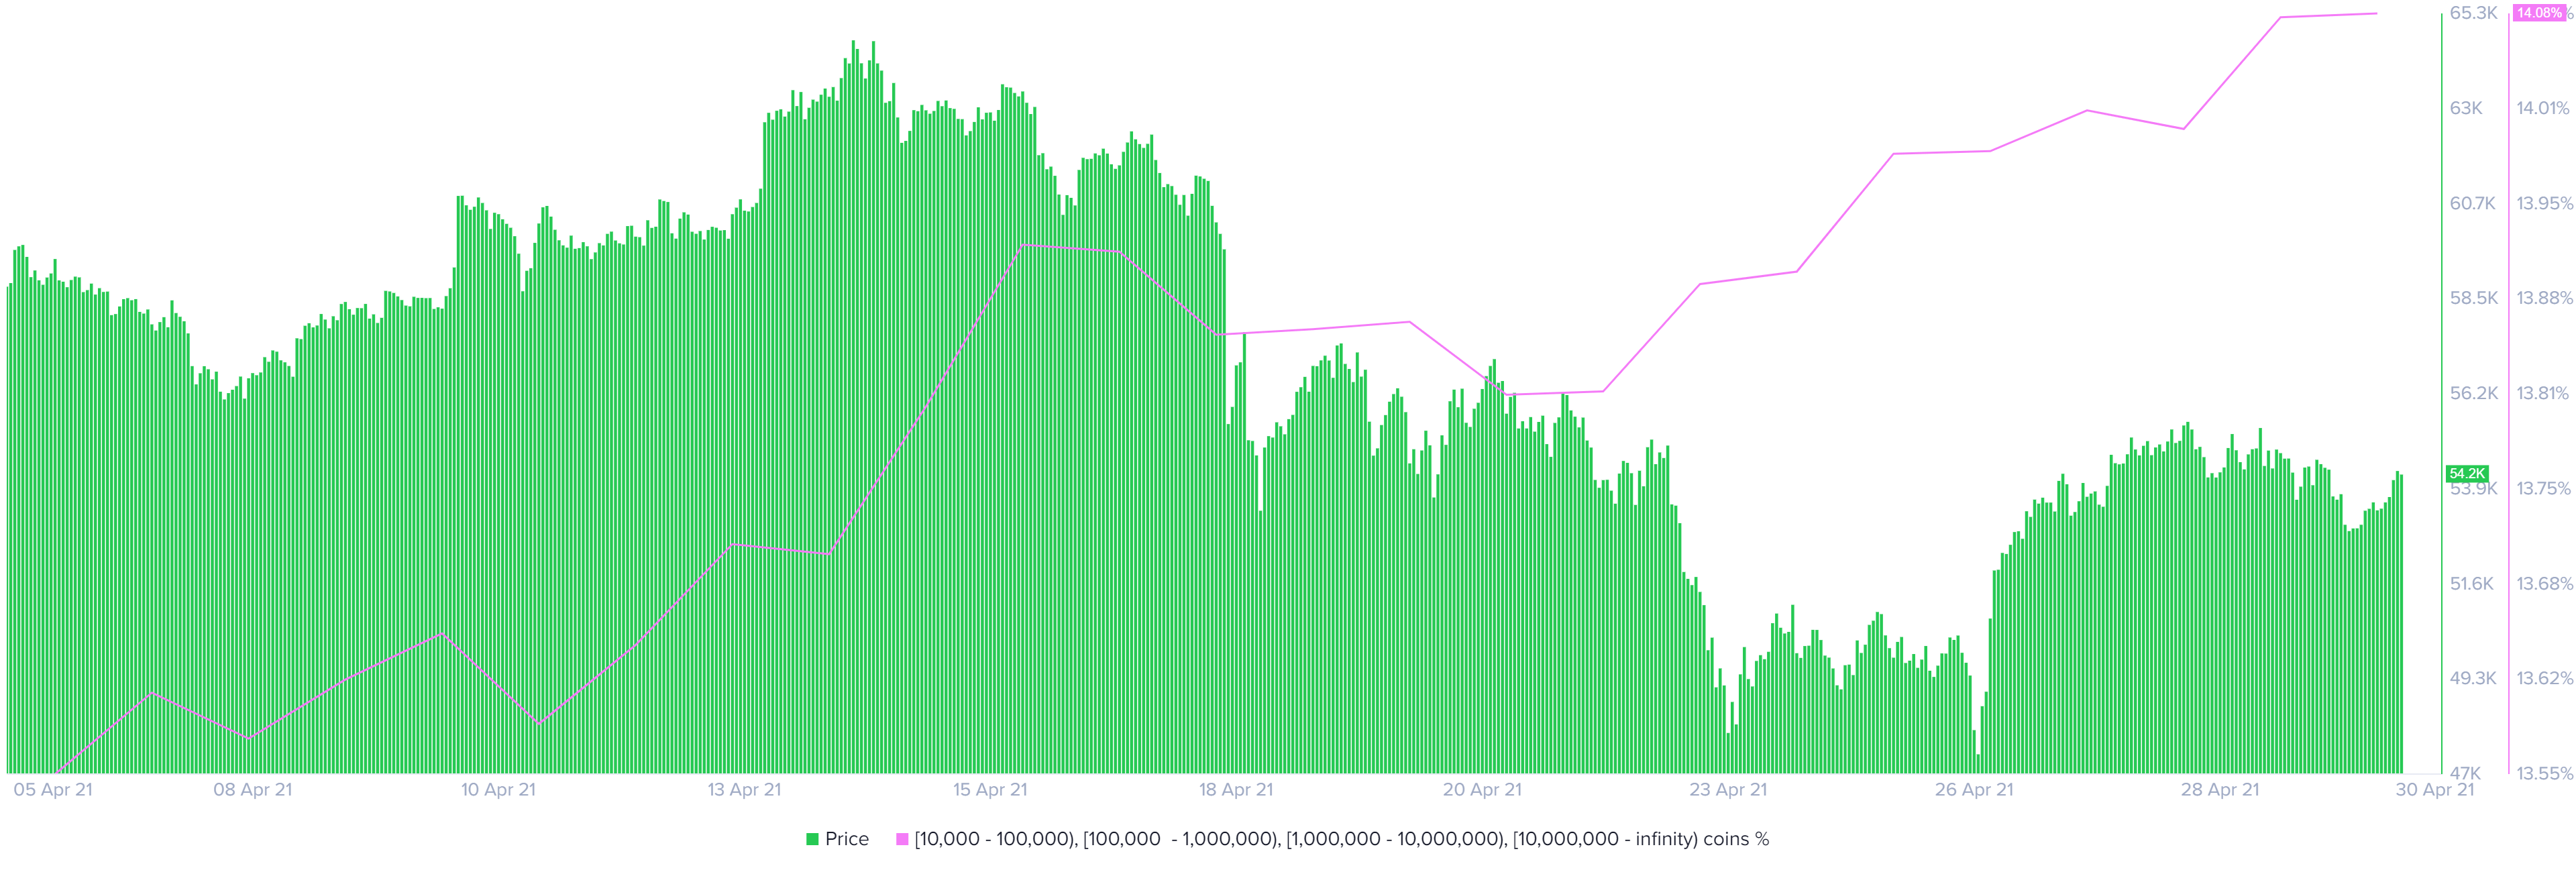
Bitcoin’s supply distribution chart shows that the number of addresses with 10,000 BTC or more has significantly increased their holdings over the past week. These high-net-worth individuals acquired roughly 60,000 BTC and now own nearly 14% of the total supply.
The massive buying pressure behind the flagship cryptocurrency opposes the bearish scenario outlined above, calling for a continuation of the uptrend.
BTC supply distribution chart
If buyers can manage to push the Bitcoin above $60,103 and hold above this crucial hurdle, the bearish scenario will likely be invalidated.
Still, investors must pay close attention to the 100-day SMA at $50,655 since a decisive close below it will send BTC into a tailspin toward the 21-week EMA at $44,996 or the 200-day SMA at $36,022.