
- Chiliz price is building the right shoulder of a head-and-shoulders bottom pattern.
- CHZ has rallied 39% over the last three days, carrying it to crucial moving average resistance.
- Volume profile is complementary to the bottom pattern.
Chiliz price, similar to the other cryptocurrencies, suffered a massive decline of over 60% from April 16 to April 22. Surprisingly, CHZ managed to hold the 10-week simple moving average (SMA) on a closing basis, highlighting how extended the altcoin was from the mean. The bottoming process is taking the form of a head-and-shoulders bottom with substantial upside if constructed correctly.
A head-and-shoulders bottom pattern is a famous pattern, and outsiders often ridicule it, yet its profitability is high relative to other patterns. It is one of the more complex patterns because it is the union of trend lines, support or resistance lines, and rounding. The performance and success rate are relatively high, but only after completion.
In the head-and-shoulders bottom, both shoulders must be higher than the head but do not need to be the same height. Studies have shown that post-breakout performance is better if the right shoulder is slightly lower than the left shoulder. Other attributes include the peaks being more or less equidistant from each other. The volume is highest on the decline into and at the low of the left shoulder and should decline as the pattern develops.
At this point, CHZ is illustrating a constructive head-and-shoulders bottom based on the attributes categorized in the preceding paragraph. The only component missing is the right shoulder, but the intersection of the 50 twelve-hour SMA at $0.493 with the 100 twelve-hour SMA at $0.506 should provide the needed resistance to define the right shoulder. If symmetry is to be maintained, the right shoulder should develop over the next 3-5 days before breaking out.
The measured move target of the pattern is 76% from the neckline, indicating a price target of $0.921. The rally to the target will find some resistance at the key CHZ Fibonacci retracement levels of the April decline, but the topside trend line from the March high through the April high will offer the most significant challenge at $0.812.
Additional upside targets include the 138.2% extension of the April decline at $1.049 and then the 161.8% extension at $1.174.
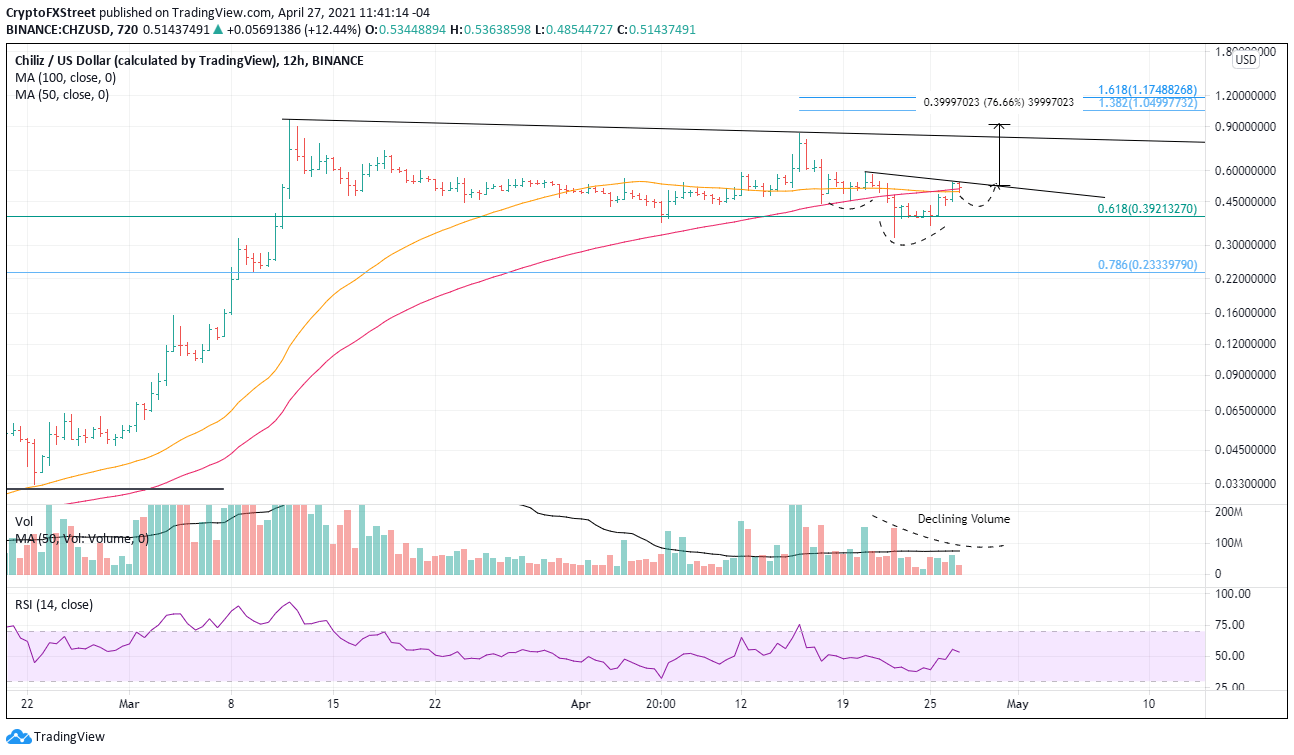
CHZ/USD 12-hour chart
The bearish alternative will take precedent if CHZ fails to hold the 61.8% retracement of the February-March advance at $0.392. It will signify that a more complex bottom is unfolding, including the potential for at least a test of the correction low at $0.318. The following support is the 78.6% retracement of the February-March advance at $0.233.