
The China May official Services PMI arrived at 55.2 vs 54.9 in April and way above the expected 52.7.
The China May NBS Manufacturing was a slight disappointment though, arriving at 51 vs 51.1.
Overall, the Composite was 54.2.
”Recent stronger growth in the services index indicates that this sector is catching up and the recovery is balancing out,” analysis at Westpac said.
As for manufacturing, there were already signs that manufacturers are reducing inventories e.g. in steel and coal, rather than producing more, analysts at TD Securities explained.
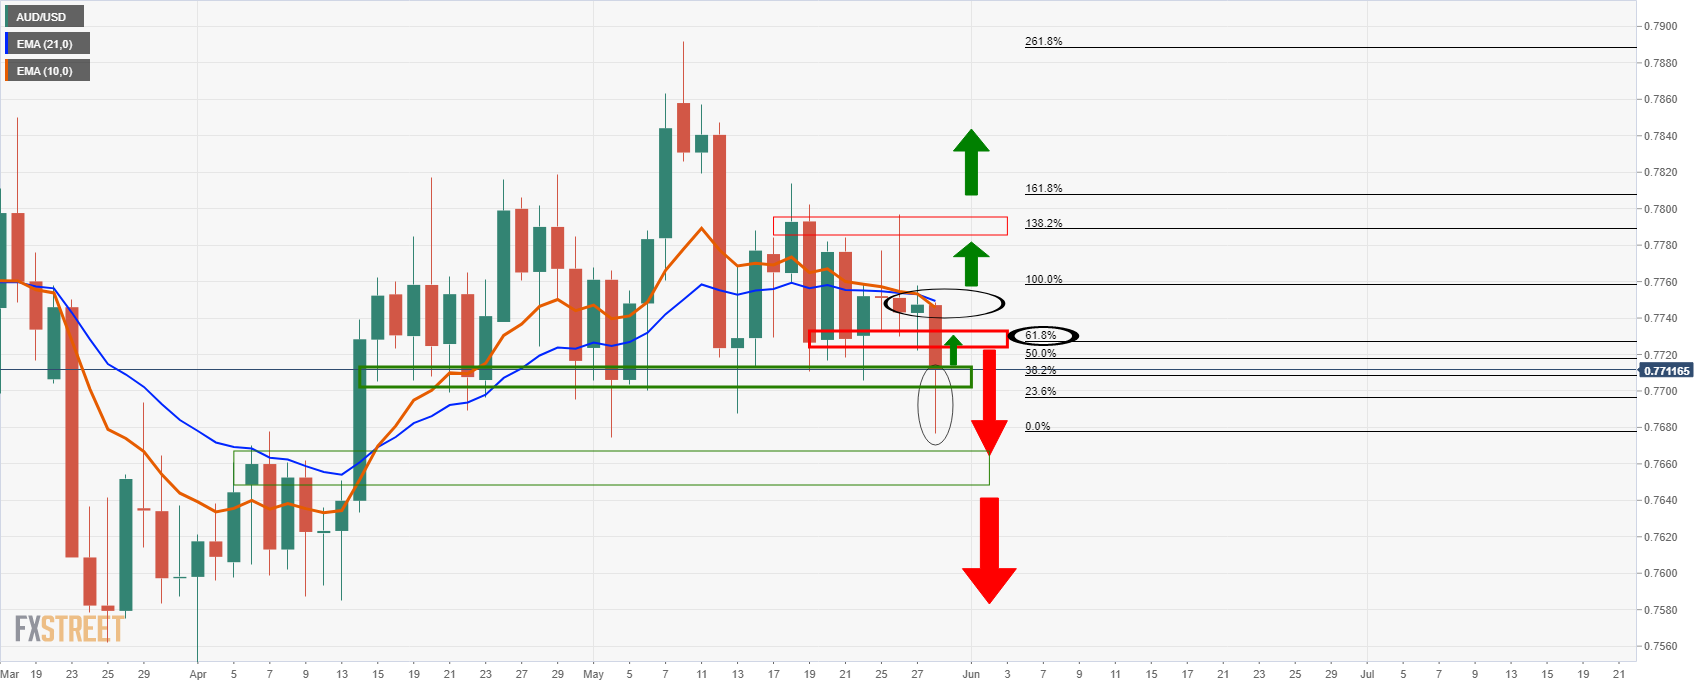
Meanwhile, as for AUD/USD, bulls are perking up on the data.
AUD/USD is starting to move into positive territory at 0.7716 the high.
As for the technical, in the prior analysis, it is explained that ”there is a risk of an upside continuation on the correction to test deeper into the resistance of the M-formation prior to a continuation to the downside.
Much will depend on how the DXY fares outside of the trendline resistance n the DXY as displayed above.”
It is released by the China Federation of Logistics and Purchasing (CFLP) studies business conditions in the Chinese manufacturing sector. Any reading above 50 signals expansion, while a reading under 50 shows contraction. As the Chinese economy has an influence on the global economy, this economic indicator would have an impact on the Forex market.
The official Non-Manufacturing PMI, released by China Federation of Logistics and Purchasing (CFLP), is based on a survey of about 1,200 companies covering 27 industries including construction, transport and telecommunications. It’s the level of a diffusion index based on surveyed purchasing managers in the services industry and if it’s above 50.0 indicates industry expansion, below indicates contraction.