Crude Oil Outlook:
- News that the delta variant is proving problematic has introduced a new layer of uncertainty into markets.
- Having already cleared both the 2020 high (65.65) and the descending trendline from the July 2008 and June 2014 highs, it appears we’re still in the early innings of a major bottoming effort.
- According to the IG Client Sentiment Index, crude oil prices have a mixed bias.
Crude Oil Prices Floating Up; Caution
With global demand increasing at a torrid pace post-pandemic and OPEC+ keeping production cuts in place for the foreseeable future, the near-term supply-demand imbalance remains a viable catalyst for more gains in crude oil prices. News emerged on Tuesday that OPEC+’s Joint Technical Committee ended its meeting without even discussing potential production hikes.
Historically, changes in crude oil demand track global growth with a near-perfect correlation, so as long as the bull case for global growth remains, then energy should be in strong demand as OPEC+ continues to curtail supply.
Having already cleared both the 2020 high (65.65) and the descending trendline from the July 2008 and June 2014 highs, it appears we’re still in the early innings of a major bottoming effort. It’s worth noting, however, that the recent evolution in the crude oil price and crude oil volatility relationships warns that the float higher may soon be hobbled.
Relationship Between Oil Volatility and Oil Prices Flips
Crude oil prices have a relationship with volatility like most other asset classes, especially those that have real economic uses – other energy assets, soft and hard metals, for example. Similar to how bonds and stocks don’t like increased volatility – signaling greater uncertainty around cash flows, dividends, coupon payments, etc. – crude oil tends to suffer during periods of higher volatility.
Heightened uncertainty in financial markets due to increasing macroeconomic tensions decreases theoretical demand for energy; signs that the global economy is recovering from the coronavirus pandemic reduces uncertainty, and thus, volatility. News that the delta variant is proving problematic has introduced a new layer of uncertainty into markets.
OVX (Oil Volatility) Technical Analysis: Daily Price Chart (June 2020 to June 2021) (Chart 1)
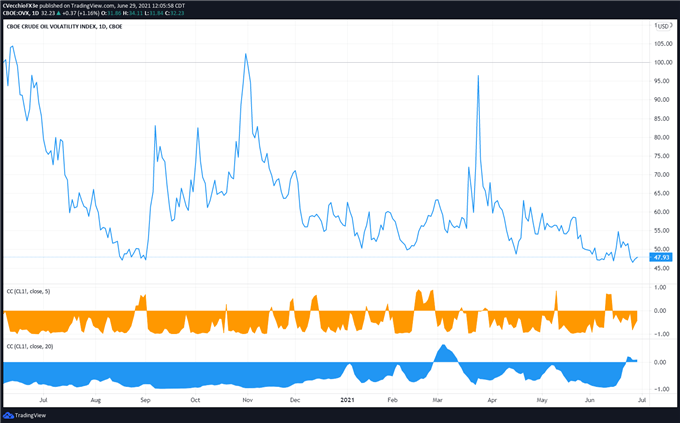
Oil volatility (as measured by the Cboe’s gold volatility ETF, OVX, which tracks the 1-month implied volatility of oil as derived from the USO option chain) was trading at 47.93 at the time this report was written. Oil volatility continues to persist around levels experienced going back to 2019.
However, the price action in oil prices and shifts in volatility term structures after the June Federal Reserve meeting have seen the typical crude oil price and oil volatility relationship flip; in fact, this is the first sustained positive correlation between crude oil prices and volatility since March, which marked a near-term top for crude oil prices. This is a red flag for bullish traders.
The 5-day correlation between OVX and crude oil prices is -0.44 while the 20-day correlation is +0.08; and one week ago, on June 22, the 5-day correlation was -0.37 and the 20-day correlation was -0.07.
Crude Oil Price Technical Analysis: Daily Chart (June 2020 to June 2021) (Chart 2)
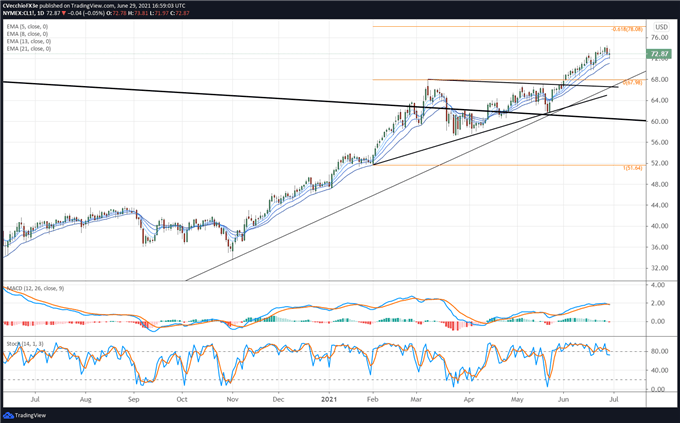
In the crude oil price forecast at the start of June it was noted that “crude oil prices have broken out of a symmetrical triangle on the daily timeframe, decisively clearing both the 2020 high (65.65) and the descending trendline from the July 2008 and June 2014 highs…more gains may be ahead.” Having just touched fresh yearly highs last week in the context of the uptrend from the April 2020, November 2020, and May 2021 swing lows intact, the technical posture remains bullish.
As a potential red flag, the changing relationship between crude oil volatility and prices suggests that traders should be on alert for a change in technical conditions around crude oil prices. Of note, the daily 8-EMA has not been breached on a closing basis since May 21; a break below here would be an indication that a near-term top is forming. For now, crude oil prices are above their daily 5-, 8-, 13-, and 21-EMA envelope, which is in bullish sequential order (though barely). Daily MACD is trending lower albeit above its signal line, while daily Slow Stochastics are just starting to ease from overbought territory.
Crude Oil Price Technical Analysis: Weekly Chart (January 2008 to June 2021) (Chart 3)
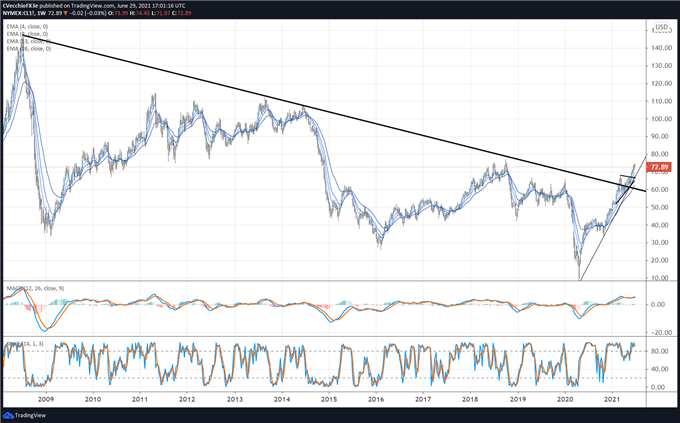
In the prior crude oil price forecast it was noted that “holding in make-or-break territory, improvements in the technical structure on lower timeframes suggests that a breakout attempt may soon emerge…the breakout has thus arrived; the rally towards the 2018 high at 76.90 has begun.” While the 2018 high has not been reached, it stands to reason that a pullback on lower timeframes should be eyed for potential opportunities to enter (or re-enter) the market on the long side. Until the pandemic uptrend breaks, there is no good technical reason to be bearish.
IG CLIENT SENTIMENT INDEX: CRUDE OIL PRICE FORECAST (June 29, 2021) (CHART 4)
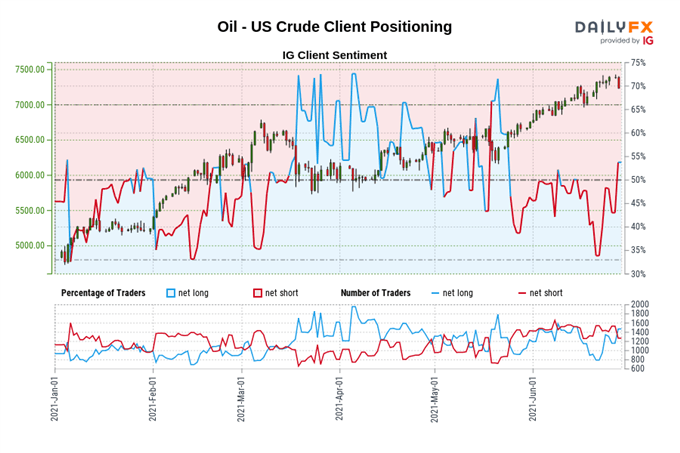
Oil – US Crude: Retail trader data shows 48.01% of traders are net-long with the ratio of traders short to long at 1.08 to 1. The number of traders net-long is 3.07% lower than yesterday and 36.35% higher from last week, while the number of traders net-short is 1.16% lower than yesterday and 7.62% lower from last week.
We typically take a contrarian view to crowd sentiment, and the fact traders are net-short suggests Oil – US Crude prices may continue to rise.
Positioning is more net-short than yesterday but less net-short from last week. The combination of current sentiment and recent changes gives us a further mixed Oil – US Crude trading bias.
— Written by Christopher Vecchio, CFA, Senior Currency Strategist