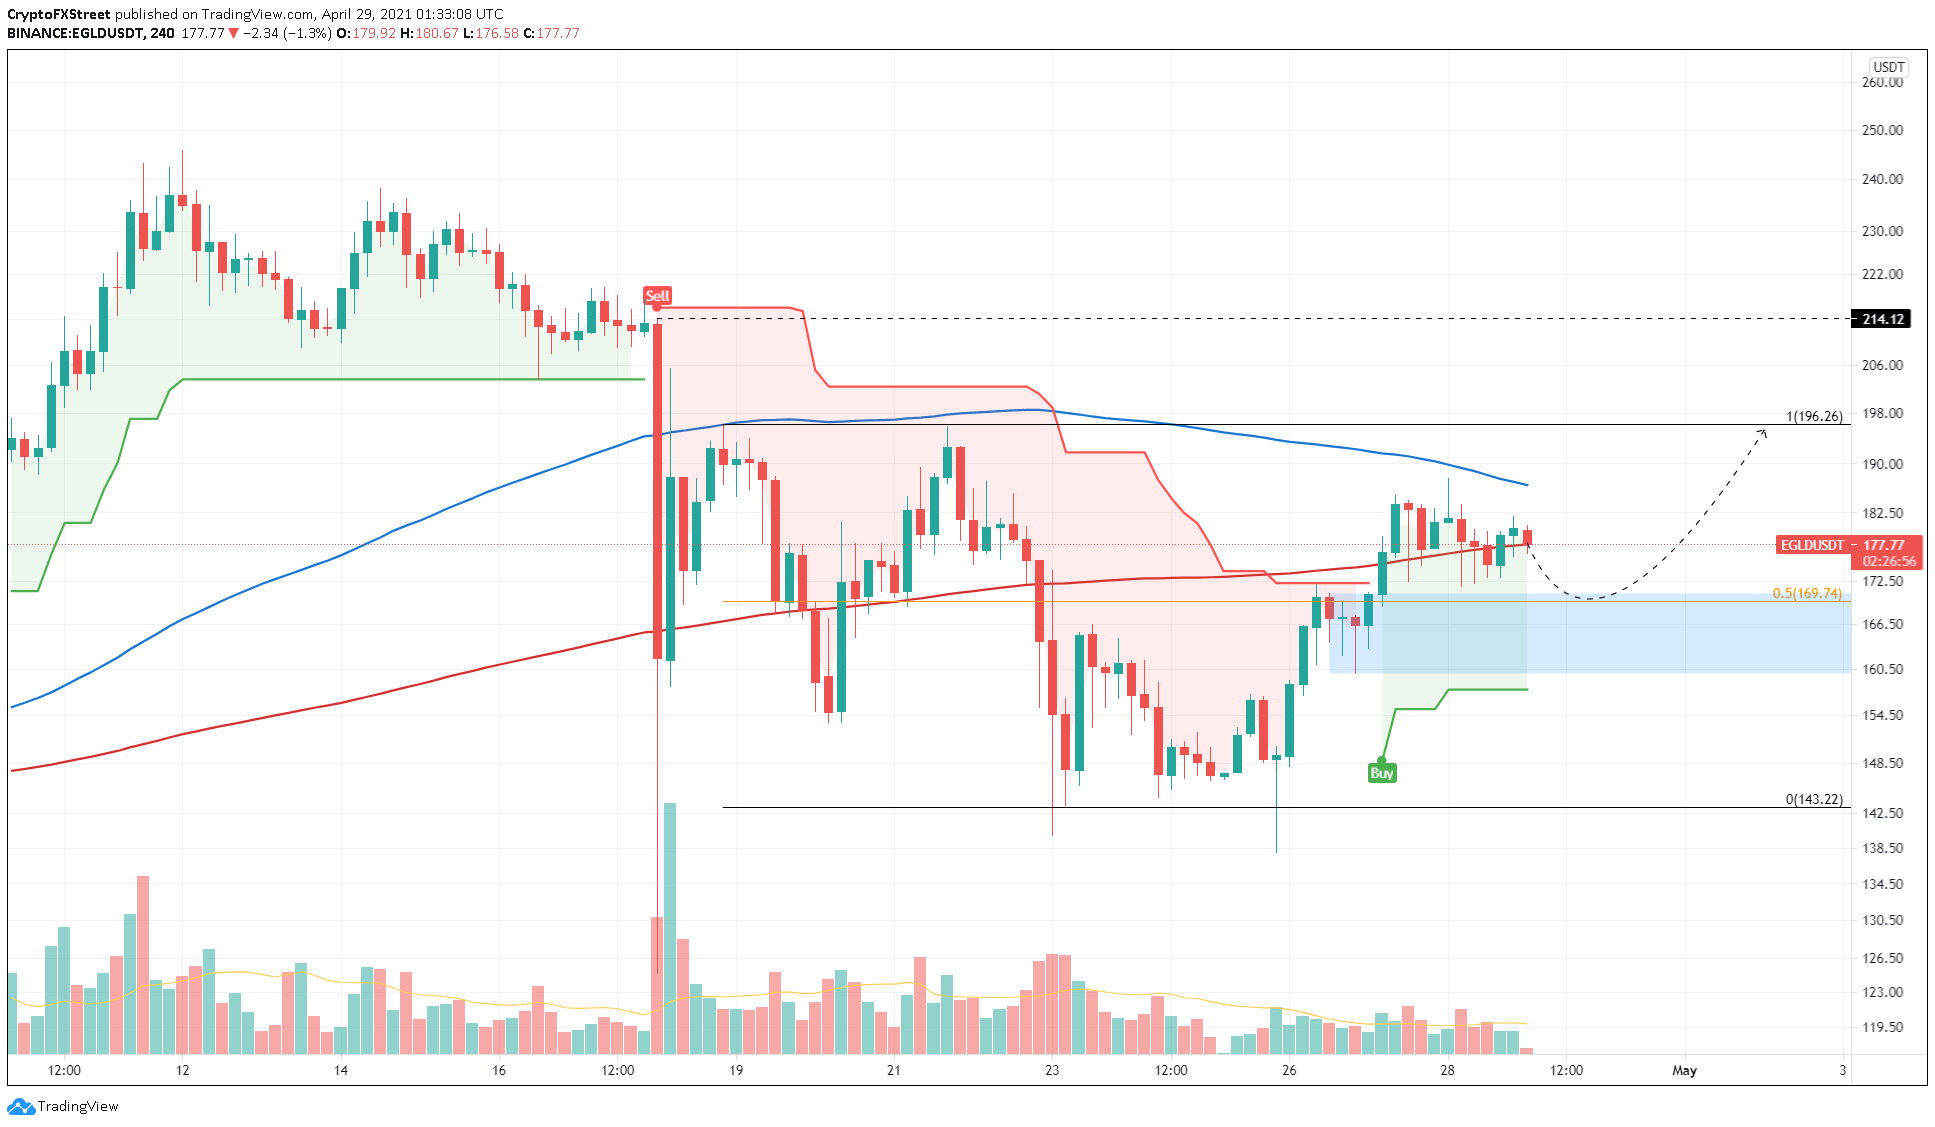
- Elrond price shows consolidation between the 100 and 200 SMA on the 4-hour chart.
- EGLD might retest the upper boundary of a demand barrier ranging from $160 to $170.
- Such a move might allow the bulls to propel the altcoin by 15% to $196.26.
Elrond price shows a lack of momentum that has caused it to move sideways. A minor retracement is plausible before EGLD breaks the market structure and turns bullish.
On the 4-hour chart, Elrond price seems to have climbed above the 200 Simple Moving Average (SMA) at $177.75, but the lack of buying pressure has prevented it from flying higher. If the sellers topple the bulls, a retest of the demand zone that extends from $160 to $170 seems likely.
Investors can expect a resurgence of buyers here, preventing Elrond price from forming a lower low and kickstarting a 15% upswing to $196.26. A confirmation of this bullish spike will arrive after EGLD produces a decisive close above the 100 SMA at $186.50.
Adding a tailwind to this scenario is the SuperTrend indicator’s buy signal flashed on April 27.
EGLD/USDT 4-hour chart
On the flip side, a successful breach of the support barrier’s lower trend line at $160 will signal an increasing sell-side pressure. If the Elrond price closes below $157 on the 4-hour chart, it will create a lower low, signaling the start of a new downtrend.
In such a case, EGLD could slide 6% to $150.


