In this technical blog, we will look at the past performance of 1 hour Elliott Wave Charts of Facebook ticker symbol: FB, which we presented to members at the elliottwave-forecast . In which, the rally from 14 January 2021 low unfolded as an impulse structure. And showed a higher high sequence favored more upside extension to take place. Therefore, we advised members not to sell the stock & buy the dips in 3, 7, or 11 swings at the blue box areas. We will explain the structure & forecast below:
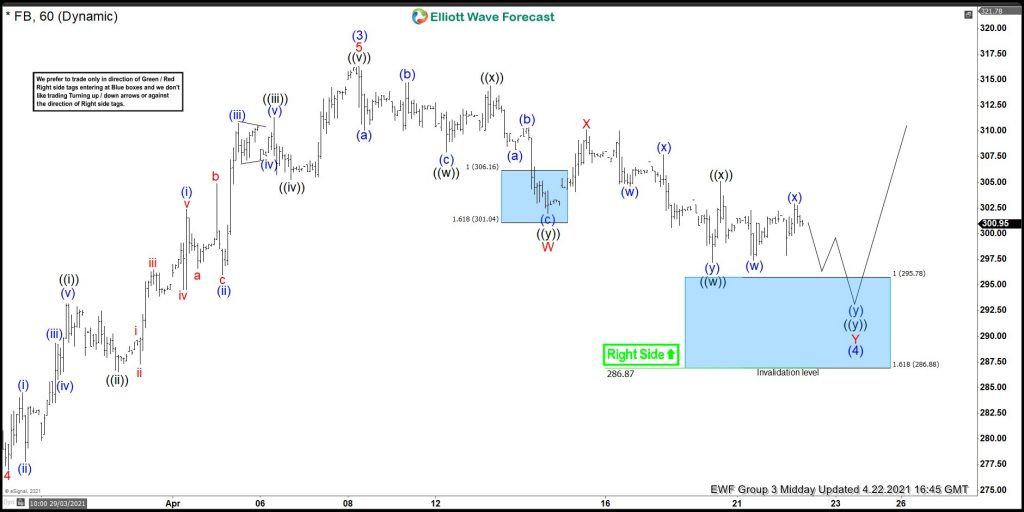
Above is the 1hr Elliott wave chart of Facebook from the 4/22/2021 update. In which, the rally to $316.25 high ended wave (3) of an impulse sequence coming from 1/14/2021 low. Down from there, the stock made a pullback to correct the short-term cycle from 2/25/2021 low within wave (4). The internals of that pullback unfolded as Elliott wave double three structure where wave W ended in 3 swings at $301.95 low. Wave X bounce ended at the $310.14 high. Wave Y was expected to reach the blue box area at $295.78- $286.88 100%-161.8% Fibonacci extension area of W-X. From there, buyers were expected to appear looking for further upside ideally or for a 3 wave bounce at least. (It’s important to note that with further data we were able to adjust the degree of a pullback).
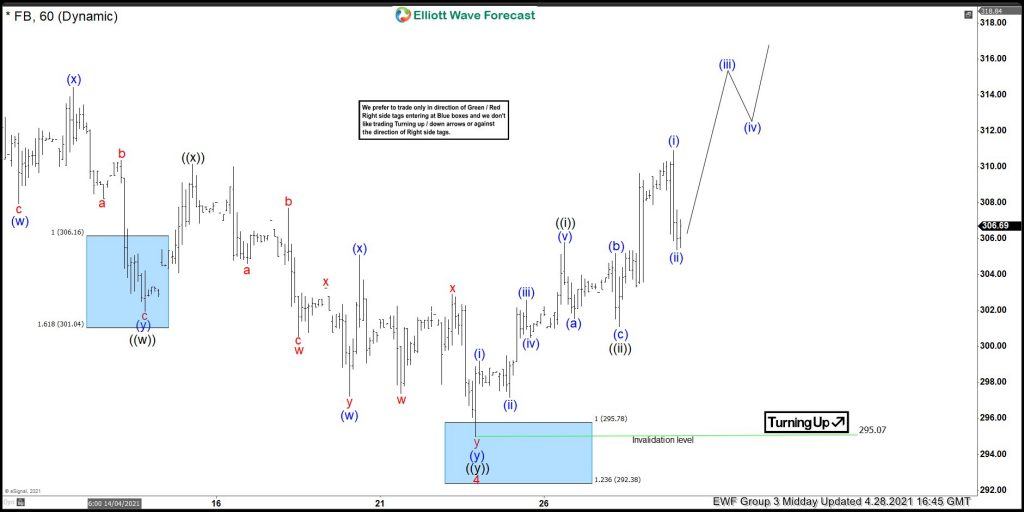
Here’s the 1hr Elliott wave chart of Facebook from the 4/28/2021 Midday update. The stock is showing a strong reaction higher taking place from the blue box area after ending the double correction at $295.07 low. Allowed members to create a risk-free position shortly after taking the long positions at the blue box area.