

GBP/USD Outlook: Neutral
The British Pound (GBP) falters as double-digit inflation weighs on the economic outlookUS Dollar (USD) struggles to recover from dampened sentiment amid a potential banking crisisGBP/USD trades at a critical juncture, around Fibonacci resistance at 1.230
GPB/USD Fundamental Analysis: UK Inflation and a More Dovish Fed Places UK GDP and PCE in the Spotlight
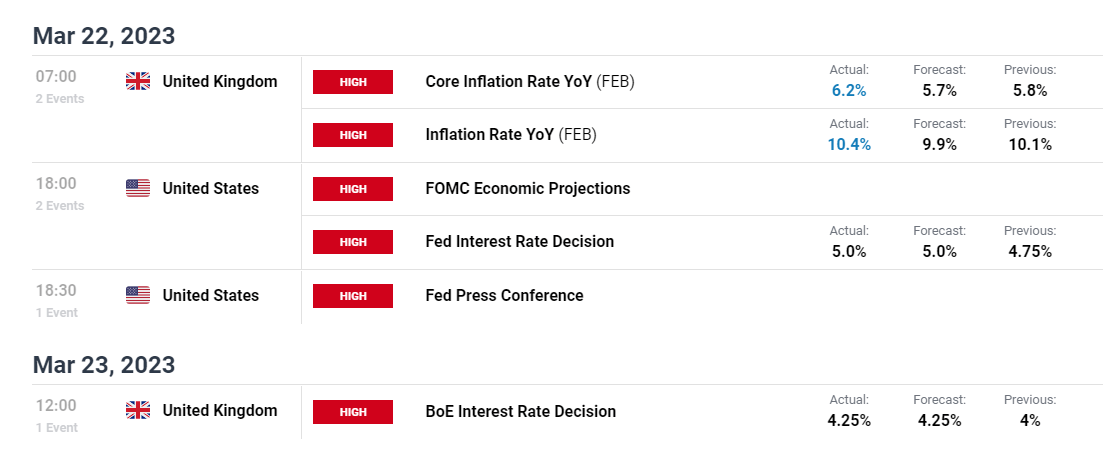
Over the past week, a series of high impact economic data and events weighed on both the British Pound and the US Dollar. While the Federal Reserve and BoE (Bank of England) announcing a 25 basis-point rate hike, the recent UK inflation print hindered further progression. With Core CPI coming in at 6.2%, the annual inflation rate rose to 10.4%, both these levels came in hotter than expected, the double-digit print poses a major threat for GBP.
For all market-moving data releases and events, see theDailyFX Economic Calendar
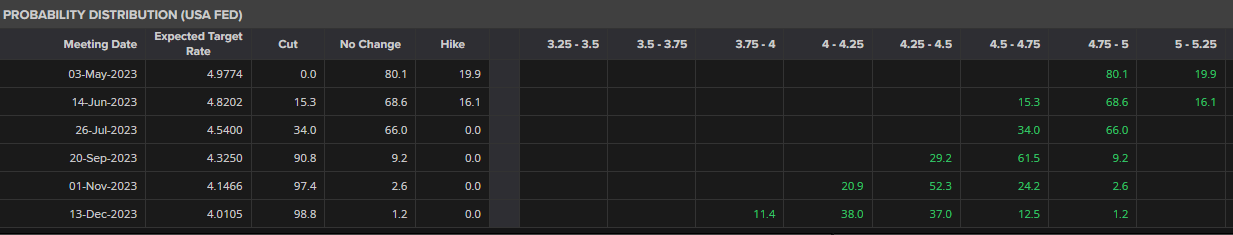
While the US banking crisis has limited the Fed’s ability to stick to its aggressive rate path, expectations have now shifted toward a pause in the rate cycle at the May meeting.
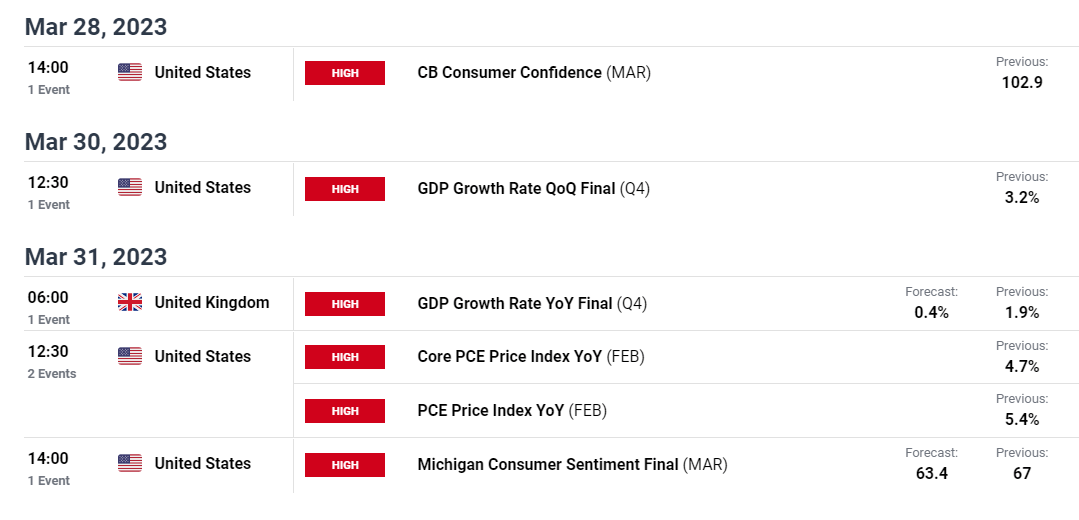
That brings the upcoming Core PCE data to the center of risk sentiment. For the UK, a slight uptick in retail sales and manufacturing PMI provided a positive lift to sentiment. The next big data print will be the GDP growth rate which will be released on Friday, March 31st.
For all market-moving data releases and events, see the DailyFX Economic Calendar
While fundamentals remain the prominent driver of price action, fears of further contagion in the banking sector has kept policymakers and individuals on high alert. With Deutsche Bank and UBS facing additional pressure on their stocks this week, recession fears remain heightened. Although the US Dollar is generally known as a safe-haven currency, the recent turn of events has favored currencies that haven’t been exposed to the crisis (at least not yet).
GBP/USD Technical Analysis:
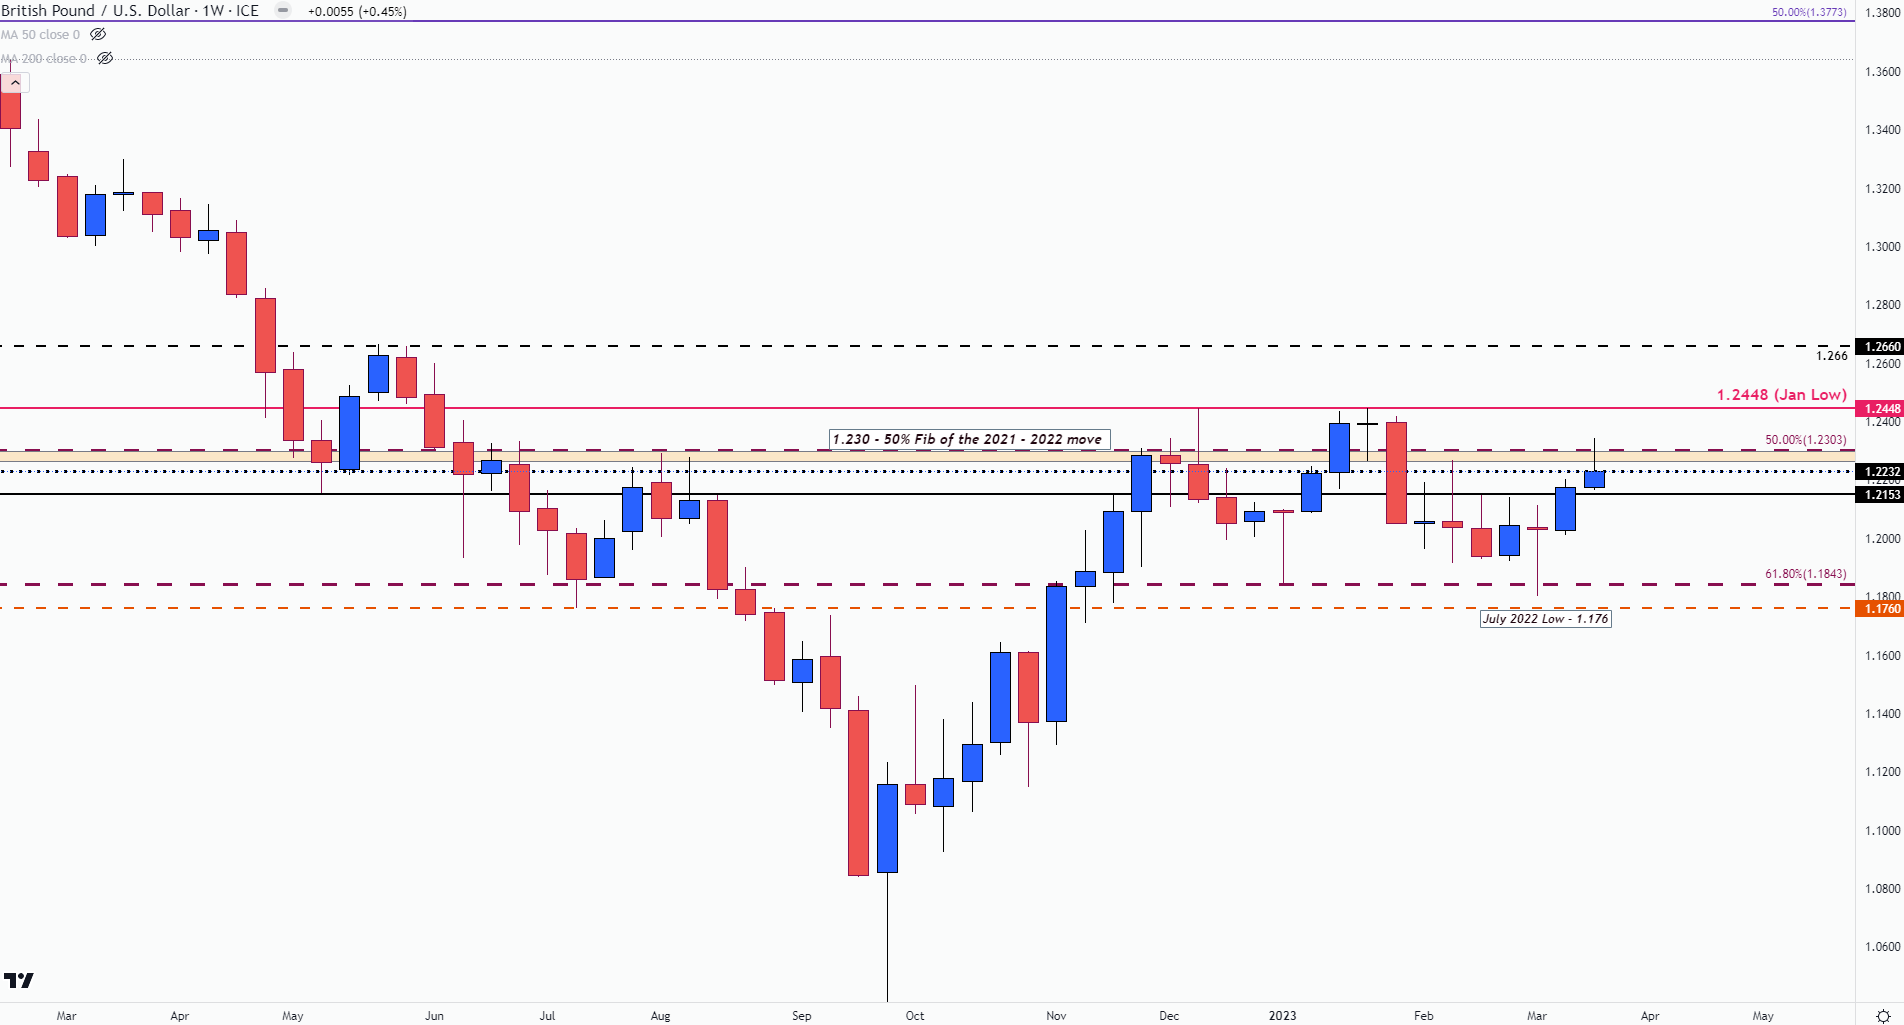
Over the past four months, GBP/USD has been trading between two key Fibonacci levels, taken from the 2021 – 2022 move.
With the 61.8% retracement currently providing support at 1.184, the 50% retracement (the mid-point) continues to hold as resistance at 1.230. As price action whipsaws between this broader range of support and resistance, this zone of confluency will likely play a role in driving both the short and longer-term move.
To Learn More AboutPrice Action,Chart PatternsandMoving Averages, Check out theDailyFX Education Section.
After temporarily breaching the above-mentioned resistance this week, failure to push prices higher resulted in a quick reaction from bears. By looking at the weekly chart below, the short-bodied candle at the bottom of the wick can be a potential warning for bulls. In technical analysis, the single candlestick pattern (known as an inverted hammer) occurs when prices rise rapidly before closing slightly above the open. This can be indicative of slowing bullish momentum.
GBP/USD Weekly Chart
Chart prepared by Tammy Da Costa using TradingView
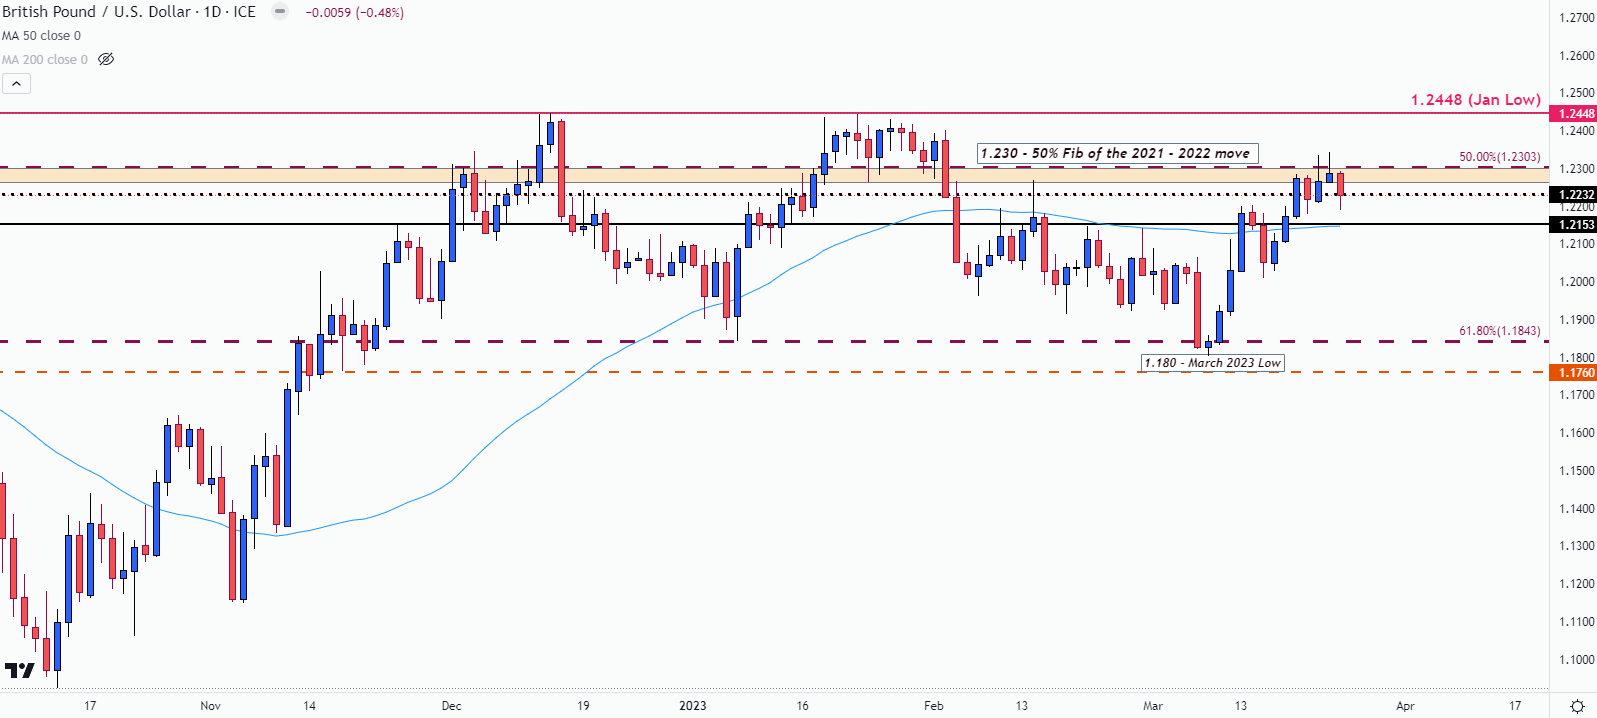
On the daily chart, this level helped cap the upside move in December and January before turning into support. With GBP/USD falling to a low of 1.180 earlier this month, the turmoil in the US banking system and the repricing of lower rates has helped lift the major currency pair.
GBP/USD Daily Chart
Chart prepared by Tammy Da Costa using TradingView
In the week ahead, the economic calendar could assist in helping the pair determine a fresh, directional bias. If prices clear resistance and hold above 1.230, it may be possible for bulls to continue to push prices toward the January high at 1.2448.
However, if GBP/USD drops below 1.215, an increase in bullish momentum could see a probable retest of 1.184.
— Written by Tammy Da Costa, Analyst for DailyFX.com
Contact and follow Tammy on Twitter: @Tams707


