Gold Technical Price Outlook: XAU/USD Weekly Trade Levels
- Gold price updated technical trade levels – Weekly Chart
- XAU/USD plummets into key support at 1768 ahead of July open / NFP– watch the weekly close
- New to Gold Trading? Get started with this Free How to Trade Gold -Beginners Guide
Gold prices has already plunged more than 1% since the start of the week with XAU/USD poised to surpass February (-7.56%) with the largest monthly decline since November of 2016 (-8.13%, one week before a multi-year low was registered). The losses have taken gold prices from uptrend resistance back into uptrend support in just the span of a month with the bears vulnerable here at support into the June close. These are the updated targets and invalidation levels that matter on the gold weekly charts heading into the July open / US Non-Farm Payroll (NFP) on Friday. Review my latest Weekly Strategy Webinar for an in-depth breakdown of this gold technical setup and more.
Gold Price Chart – XAU/USD Weekly
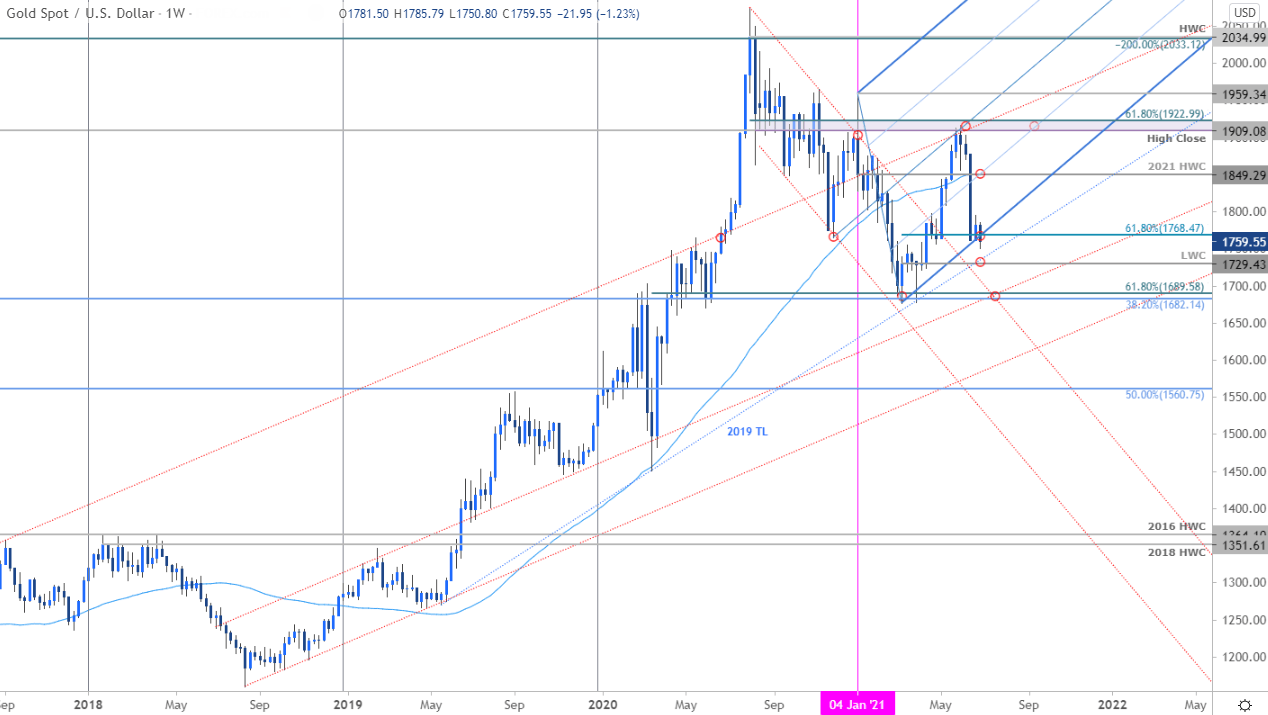
Chart Prepared by Michael Boutros, Technical Strategist; Gold on Tradingview
Notes: In my last Gold Weekly PriceOutlook we warned that a, “multi-month rally of more than 13% takes Gold prices into a critical resistance confluence and leaves the bulls vulnerable while below 1923.” XAU/USD plummeted more than 8.6% off that high with price attempting to break below confluent pitchfork support ahead of the July open / NFPs- watch the weekly close here.
A close below the 61.8% Fibonacci retracement of the March advance at 1768 would be needed to keep the immediate decline viable towards critical support objectives at the yearly low-week close at 1729 and the 61.8% retracement of the 2020 range / 38.2% retracement of the 2015 advance at 1682/89- both areas of interest for possible downside exhaustion IF reached. Weekly resistance steady at the yearly high-week close / 52-week moving average at 1849 with a breach / close above 1923 ultimately needed to mark resumption of the broader multi-year uptrend.
Bottom line: A massive reversal off uptrend resistance into the June open is now facing key uptrend support targets into the June close – we’re on the lookout for an exhaustion low heading into July. From a trading standpoint, a good zone to reduce short-exposure / lower protective stops – respect the weekly closes. A re-asserted close back above 1800 could be the initial tells that a near-term low is in place. As always, stay nimble into the close of the month / quarter with US Non-Farm Payrolls on tap ahead of an extended holiday break- could see some volatility. Review my latest Gold Price Outlook for a closer look at the near-term XAU/USD technical trade levels.
For a complete breakdown of Michael’s trading strategy, review his Foundations of Technical Analysis series on Building a Trading Strategy
Gold Trader Sentiment – XAU/USD Price Chart
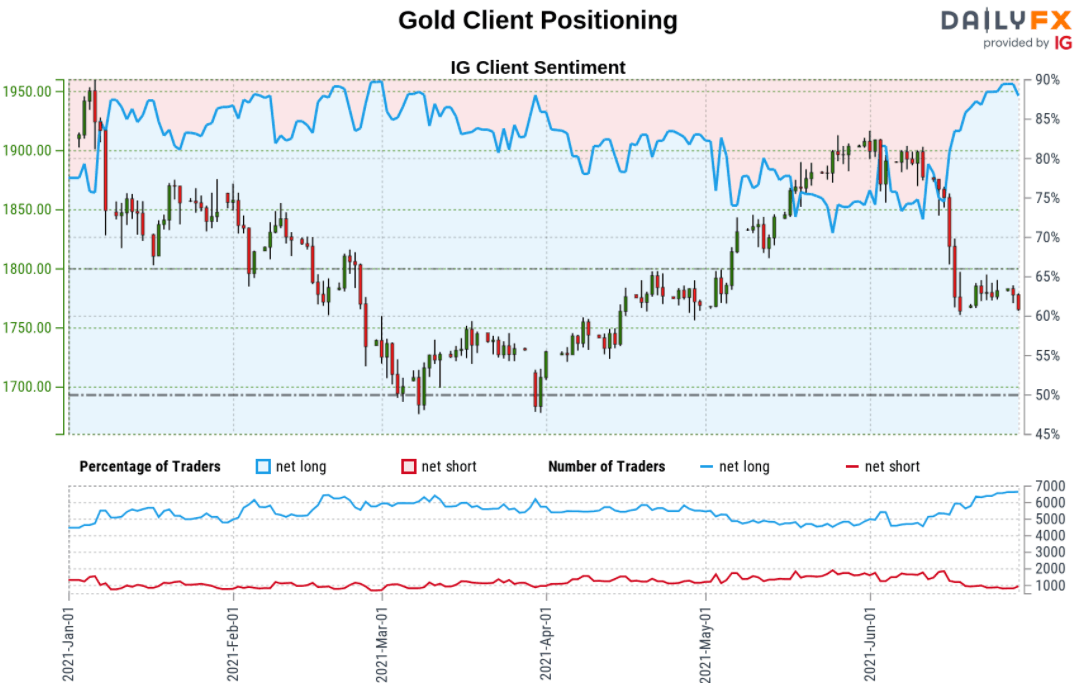
- A summary of IG Client Sentiment shows traders are net-long Gold- the ratio stands at +7.11 (87.67% of traders are long) – typically bearishreading
- Long positions are0.93% higher than yesterday and 6.95% higher from last week
- Short positions are11.14% higher than yesterday and 13.27% lower from last week
- We typically take a contrarian view to crowd sentiment, and the fact traders are net-long suggests Gold prices may continue to fall. Yet traders are less net-long than yesterday but more net-long from last week and the combination of current positioning and recent changes gives us a further mixed Gold trading bias from a sentiment standpoint.
—
Previous Weekly Technical Charts
– Written by Michael Boutros, Currency Strategist with DailyFX
Follow Michael on Twitter @MBForex