
Gold price is riding higher on concerns over dwindling global economic recovery, fuelled by Delta covid strain flareups and weaker US ISM Services PMI and German ZEW survey. The re-emergence of global economic concerns led to an influx of risk-off flows into the safe-haven assets such as the US Treasury bonds, gold etc, weighing negatively on the returns on the markets. The recent sell-off in the Treasury yields across the curve has been the main driver behind gold’s move above the $1800 mark. The US dollar’s upside also remains capped by the weakness in the yields, with the benchmark 10-year rates down about 2.50%, as of writing. Meanwhile, the risk-on action in the European equities also exerts bearish pressure on the safe-haven dollar while underpinning gold price.
Next of relevance for gold traders remain the June Fed meeting’s minutes due for release at 1800 GMT on Wednesday. The minutes could shed more light on the interest rate trajectory after the Fed delivered a hawkish surprise last month.
Read: FOMC Minutes June Preview: A view of the Jackson Hole agenda
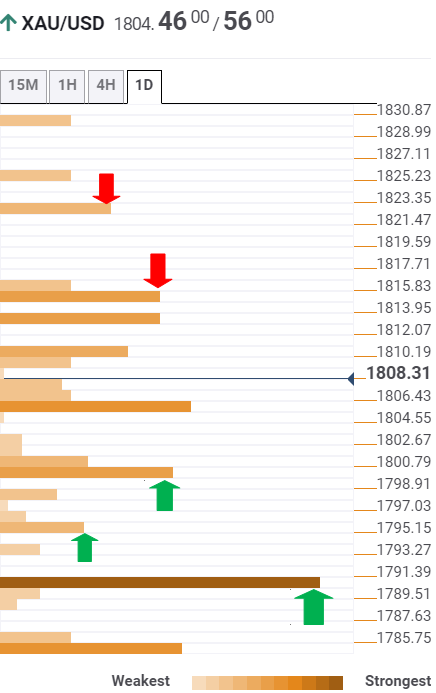
The Technical Confluences Detector shows that gold price is marching towards the previous day’s high at $11815, where the Fibonacci 38.2% one-month coincides.
Ahead of that level, the confluence of the Fibonacci 23.6% one-day and pivot point one-day R1 at $1810 could challenge the latest leg up.
If Tuesday’s high is taken out convincingly, a rally towards the pivot point one-week R2 at $1822 cannot be ruled out.
Alternatively, strong support awaits at $1800, which is the intersection of the Fibonacci 61.8% one-day, SMA10 four-hour and SMA10 one-hour.
The next relevant cushion is seen at the previous week’s high of $1795.
Powerful support at $1790 is the level to beat for gold bears. That level is the convergence of the SMA100 one-day, Fibonacci 23.6% one-month and the previous day’s low.
The TCD (Technical Confluences Detector) is a tool to locate and point out those price levels where there is a congestion of indicators, moving averages, Fibonacci levels, Pivot Points, etc. If you are a short-term trader, you will find entry points for counter-trend strategies and hunt a few points at a time. If you are a medium-to-long-term trader, this tool will allow you to know in advance the price levels where a medium-to-long-term trend may stop and rest, where to unwind positions, or where to increase your position size.