- Gold finished the previous four weeks in the positive territory.
- Next target on the upside is located at $1,930.
- Gold Weekly Forecast: XAU/USD bulls not yet ready to give up on additional gains.
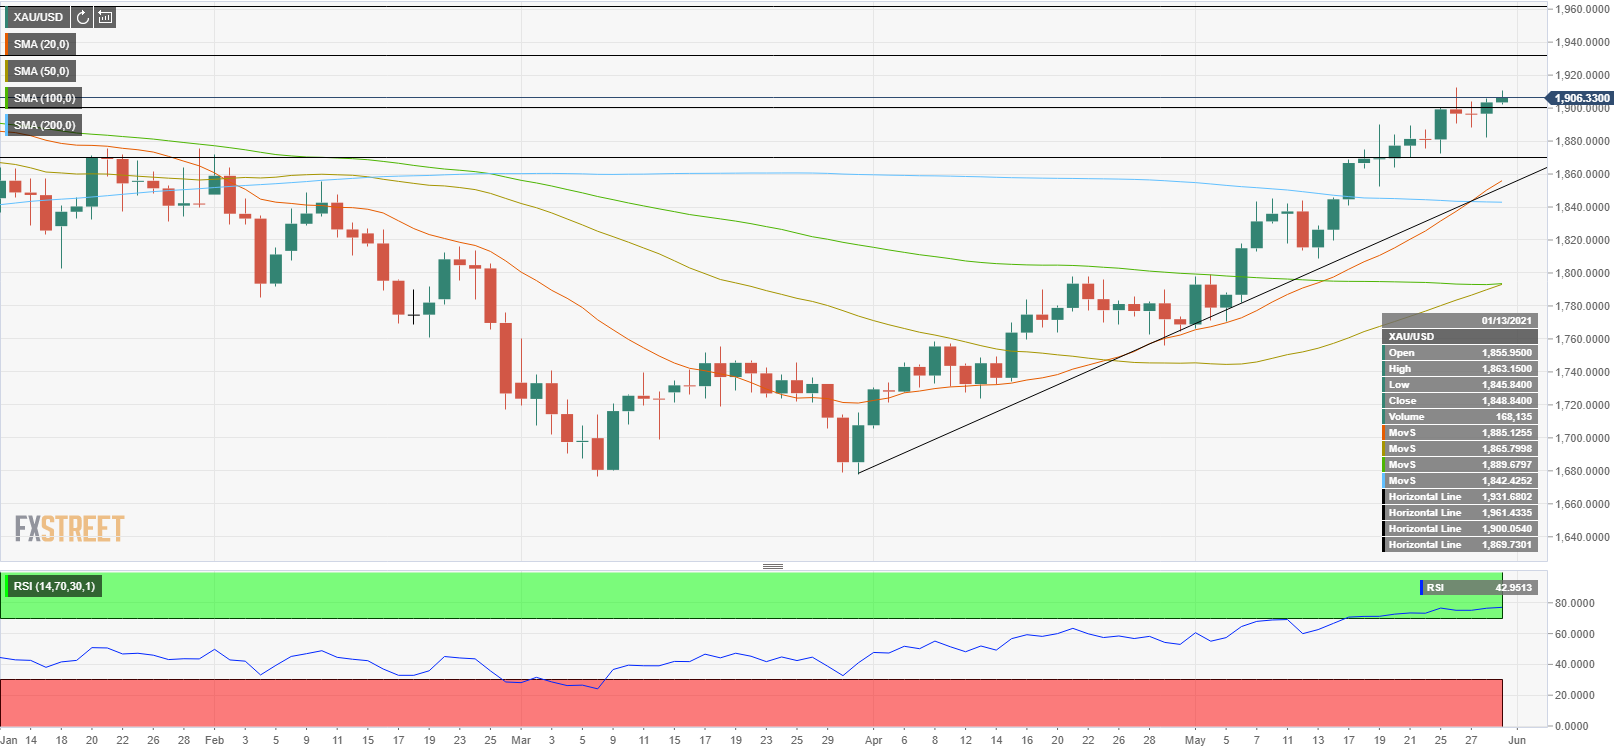
The XAU/USD pair closed the fourth straight week in the positive territory on Friday and went into a consolidation phase on Monday. Although gold climbed to a daily high of $1,910 during the European trading hours, it struggled to gather momentum and remains on track to close the day with modest gains above $1,900. Financial markets in the US will remain closed due to the Memorial Day holiday in the US and the pair is not expected to break out of its daily trading range.
Last week, the ongoing decline in the US Treasury bond yields provided a boost to gold and XAU/USD reached its highest level since early January at $1,912. Additionally, the technical buying pressure gathered strength after the price pierced through the $1,900 psychological level. However, with the benchmark 10-year US T-bond yield posting strong gains on Wednesday and Thursday, gold erased a portion of its gains.
On Tuesday, the ISM Manufacturing PMI report from the US will be looked upon for fresh impetus. The economic activity in the manufacturing sector is expected to continue to expand at a robust pace in May. Market participants will pay close attention to the Prices Paid Index component of the report, which rose to a 13-year high of 89.6 in April.
Gold Price Analysis: Three factors to drive XAU/USD higher – DBS Bank.
“The US Treasury Inflation-Protected Security (TIPS), which is a US Treasury bond with interest payments pegged to inflation, is still locked in the negative yield territory,” note DBS Bank analysts. “Negative real yields indicate a loss on guaranteed capital and hence makes gold a more attractive asset class as a form of investment given that gold bears no interest rates.”
Gold Price Analysis: XAU/USD still has legs to inch higher – OCBC.
OCBC analysts think that gold could extend its rally after closing above $1,900 for the first time since the beginning of the year.
On the daily chart, the ascending line coming from late March remains intact, confirming the view that the near-term outlook is still bullish. However, the Relative Strength Index (RSI) indicator on the same chart has been floating above 70 for the past two weeks, suggesting that the pair hasn’t yet corrected its overbought conditions.
On the downside, the initial support is located at $1,900 (psychological level. A daily close below that level could trigger a deeper correction toward $1,870 (static level, ascending line) but buyers are likely to see that as an opportunity to ramp up their long positions. In case this level turns into a resistance, the near-term outlook could turn bearish.
On the other hand, the initial resistance could be seen at $1,912 (May 26 high) ahead of $1,930 (static level).