- Shibu Inu price continues to drift lower along the 50 four-hour simple moving average (SMA).
- SHIB symmetrical triangle breakout on May 24 is still live despite the pullback to the triangle apex.
- Inside days on May 25 and May 26 failed to generate a powerful range expansion for the digital token.
Shiba Inu price engineered an impulsive break out from a symmetrical triangle pattern on May 24. SHIB has since failed to build on the breakout, instead showing a lack of decisiveness as it drifts lower between the 50 four-hour SMA and triangle’s upper trend line.
From May 19 until May 24, Shiba Inu price created a symmetrical triangle pattern with two reaction highs and three reaction lows and a measured move target of $0.00001450, representing a gain of 50%.
The May 24 breakout to the upside was over 30%, clearing the 50 four-hour SMA. The SHIB breakout has not officially failed at the time of writing, as it balances on the last level of support.
Shiba Inu price rests at the symmetrical triangle’s apex at $0.00000764. If SHIB holds critical support and registers a four-hour close above the guiding moving average, the digital asset should rally towards the original measured move target of $0.00001450. It would be more than an 80% gain from price at the time of writing.
A new SHIB rally will encounter resistance at the May 24 high at $0.00001204, the May 16 low at $0.00001238 and the 23.6% Fibonacci retracement of the decline beginning on May 10 at $0.00001325.
If the cryptocurrency complex resumes the bounce from the crash lows, fueling FOMO, Shiba Inu price could reach the 38.2% retracement at $0.00001793 before a notable pullback.
It is essential to note that Shiba Inu price has closed with four inside days over the last seven trading days, reflecting a heightened level of indecision among the ranks of SHIB investors. Some of the indecision is a function of the volatility in the broader market and a reluctance to commit to the new but extraordinarily hyped cryptocurrency. Hence, Shiba Inu price may require a compelling catalyst to resolve the lack of decisiveness.
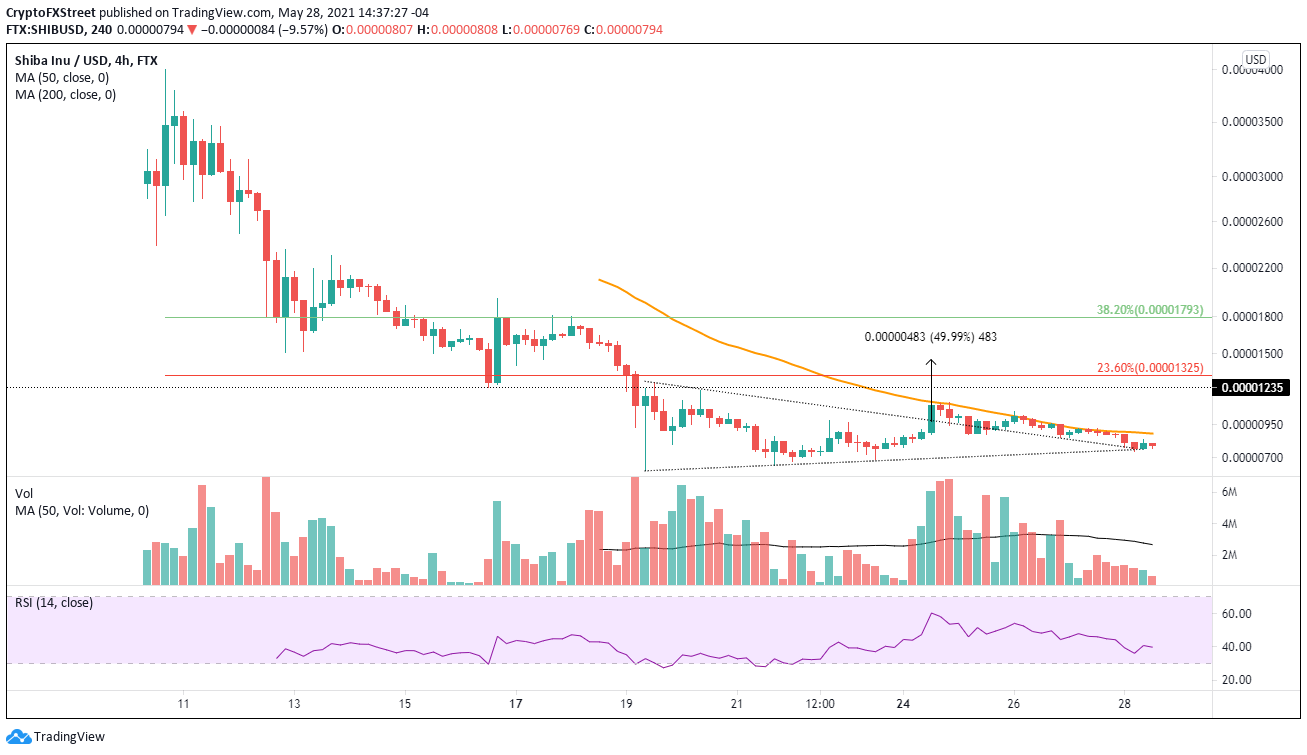
SHIB/USD 4-hour chart
A four-hour close below the apex at $0.00000764 would void the bullish SHIB narrative. A decline below the May 19 low at $0.00000607 would confirm a negative outlook and leave Shiba Inu price vulnerable to continuing the larger downtrend originating on May 10.