- Silver edged lower for the third consecutive session on Friday, though lacked follow-through.
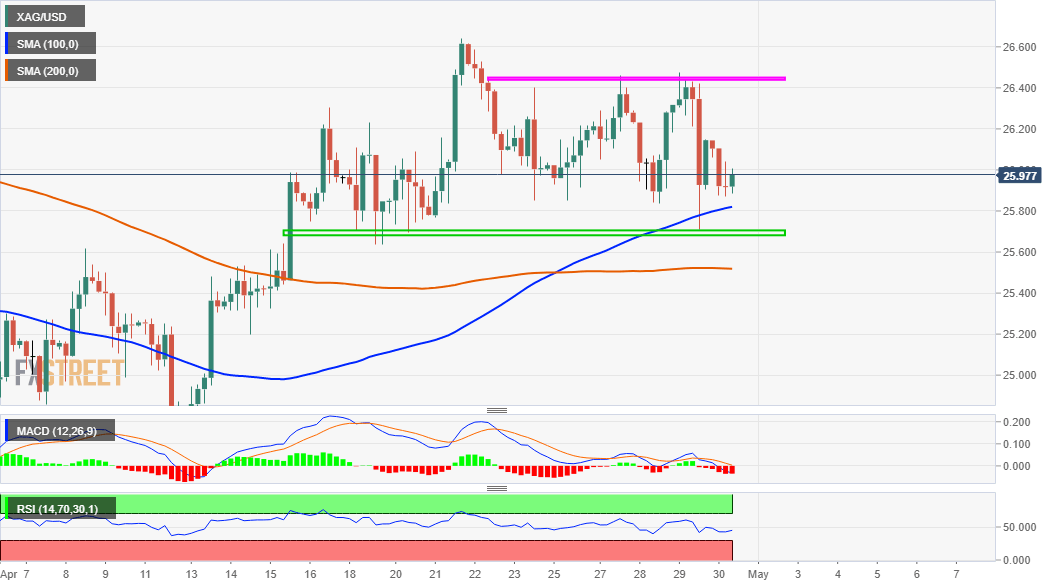
- The recent price action constitutes the formation of a rectangle pattern on short-term charts.
- Weakness below $25.75-70 will mark a bearish break and set the stage for a further decline.
Silver failed to capitalize on the previous day’s bounce from the $25.75-70 support zone and traded with a mild negative bias for the third consecutive session on Friday. The white metal remained depressed through the mid-European session and was last seen hovering around the $26.00 mark.
Looking at the technical picture, the XAG/USD has been oscillating in a narrow trading band over the past two weeks or so. The rangebound price action constitutes the formation of a rectangle, suggesting indecision and warranting some caution before placing any aggressive directional bets.
Meanwhile, bearish technical indicators on hourly charts support prospects for an eventual breakdown through the trading range support. Moreover, oscillators on the daily chart – though have managed to hold in the bullish territory – have been struggling to gain any meaningful positive traction.
That said, it will still be prudent to wait for sustained weakness below the $25.75-70 cluster support before positioning for any further depreciating move. The XAG/USD might then turn vulnerable to accelerate the downfall further towards challenging the key $25.00 psychological mark.
Some follow-through selling will set the stage for an extension of the downfall towards the $24.65-60 horizontal support. Bearish traders might then aim to challenge the $24.00 mark before the XAG/USD eventually drops to retest YTD lows, around the $23.80-75 region touched on March 31.
On the flip side, any positive move beyond the $26.25 immediate hurdle might continue to confront stiff resistance near the $26.50-60 heavy supply zone. A sustained move beyond will mark a bullish breakout and assist the XAG/USD to aim back to reclaim the $27.00 round figure.