
Silver price is feeling the pull of the gravity, as firmer US dollar and Treasury yields dent its appeal. Further, China’s commitment to reinforce curbs on the commodities, in order to stem the price rise, continues to weigh on the industrial metal. However, rising inflation expectations and a larger US stimulus could help check the downside in silver.
How is silver price positioned on the technical charts?
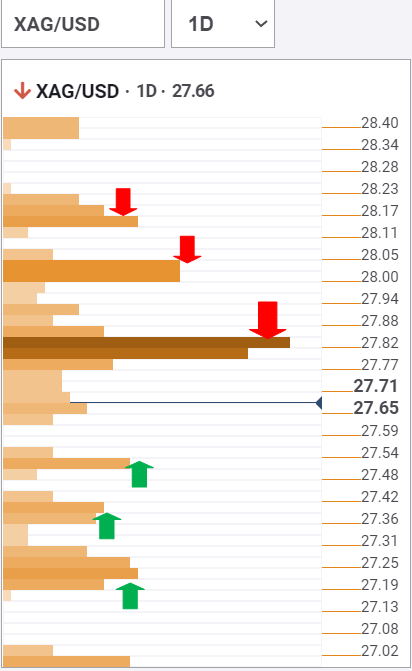
The Technical Confluences Detector shows that silver price faces powerful resistance around the $27.85 region, which is the convergence of Fibonacci 23.6% one-day, Fibonacci 61.8% one-week and SMA10 one-day.
A convincing break above that level could expose the $28 mark, where the pivot point one-day R1 coincides with the pivot point one-month R2.
The next resistance awaits at $28.17, the confluence of the pivot point one-day R2 and Fibonacci 38.2% one-week.
On the flip side, immediate support is seen at $27.50, which is the intersection of the previous day low and Bollinger Band four-hour Lower.
Further south, the pivot point one-day S2 at $27.32 could be tested.
Sellers will then target the confluence of the previous week low and pivot point one-day S3 at $27.20.
The TCD (Technical Confluences Detector) is a tool to locate and point out those price levels where there is a congestion of indicators, moving averages, Fibonacci levels, Pivot Points, etc. If you are a short-term trader, you will find entry points for counter-trend strategies and hunt a few points at a time. If you are a medium-to-long-term trader, this tool will allow you to know in advance the price levels where a medium-to-long-term trend may stop and rest, where to unwind positions, or where to increase your position size.