/https://specials-images.forbesimg.com/imageserve/60b50911097ed8e1eb4c9ae8/0x0.jpg)

getty
In the past ten years, stock scanning has become very popular. However, designing a good stock scan is just the first step. As many of you know, I spend a good part of each Saturday and Sunday running and reviewing my scans, and at the end of the month, I scan for a basket of stocks to find those that could perform the best in the months ahead. The stocks are selected using a combination of momentum, volume, relative performance, and chart formation criteria.
Developing the list of positive and negative stocks is just the first step in my scanning routine as each chart is then examined to identify the best opportunities. Whether I focus on the buy or sell list is dependent on my analysis of the market’s overall trend.
Tom Aspray – ViperReport.com
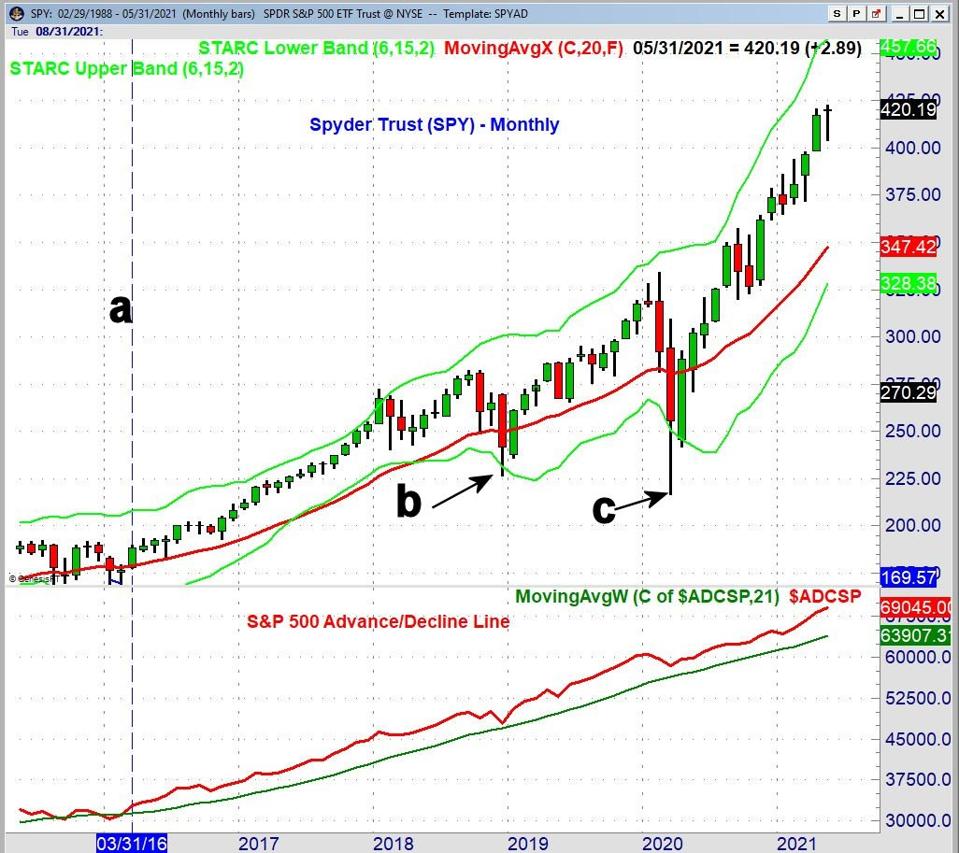
The monthly analysis of Advance/Decline lines is the most important factor in determining the market’s overall trend. The S&P 500 Advance/Decline line last positively crossed its 21-month weighted moving average (WMA) on March 31, 2016 (line a). During the sharp decline in late 2018 (point b), the SPY dropped well below its monthly starc- band. This was a sign that SPY was in a low-risk buy area and high-risk sell area. The positive reading from the A/D line indicated that the bull market was still intact, so investor long positions should be maintained.
The SPY was even more oversold in March 2020, when it had a low of $216.44 (point c), well below the monthly starc- band at $263.24. During the decline, the monthly A/D line stayed 3.7% above its rising WMA. Of course, traders should use both the readings from the weekly and daily A/D lines to manage and trade the short-term market trends. The weekly and daily A/D line analysis also closed positive in May 2021.
MORE FOR YOU
Tom Aspray – ViperReport.com
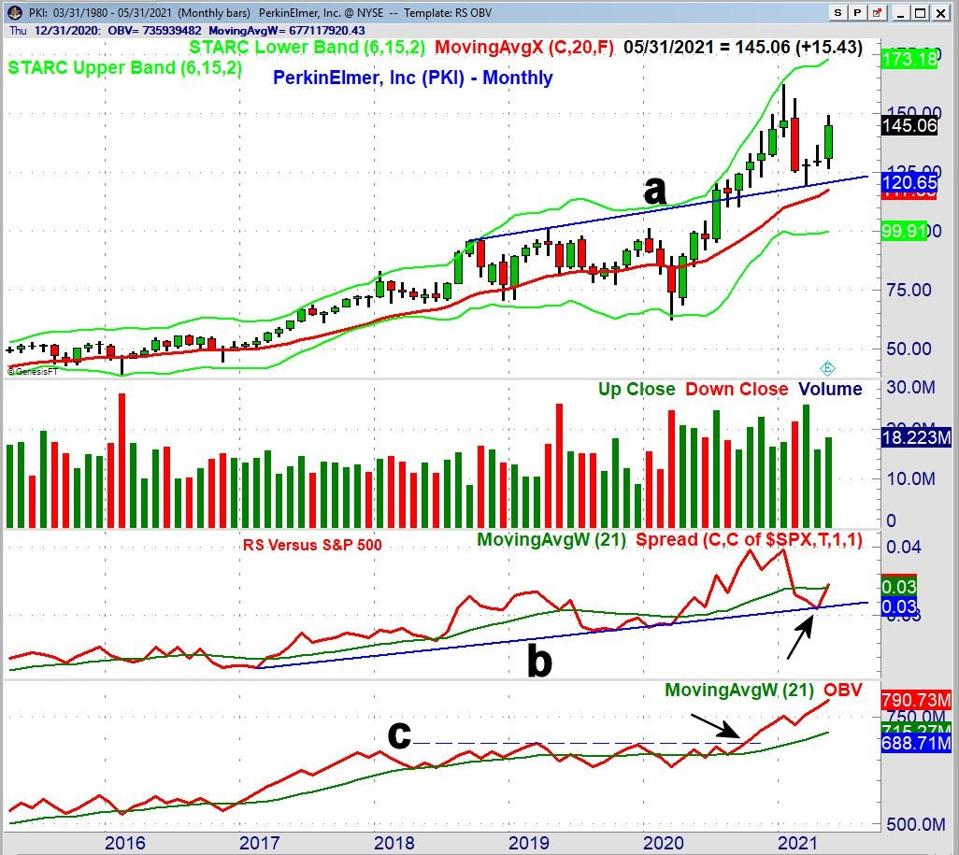
PerkinElmer (PKI) is one of the two stocks that look the best from my monthly scan. They are a healthcare diagnostics and research company that had a high of $162.54 in January. The February high at $156.52 is now initial resistance, with the monthly starc+ band at $173.18. PKI closed May at $145.06. The mid-point of last month’s range is $137.92, with the low at $126.75. The breakout level (line a) was tested in March. For June, the monthly pivot is at $140.30.
The relative performance (RS) closed back above its WMA in May, indicating that PKI was starting to lead the S&P 500. PKI’s RS had previously tested the long-term support (line b) after making a new high early in the year. The weekly RS (not shown) crossed above its WMA two weeks ago. The volume increased in May, but was below the March high.
The On-Balance Volume (OBV) moved above resistance (line c) last October, which was a very bullish sign. It has made new highs over the past two months, leading prices higher. The OBV suggests that the January high is likely to be exceeded.
Tom Aspray – ViperReport.com
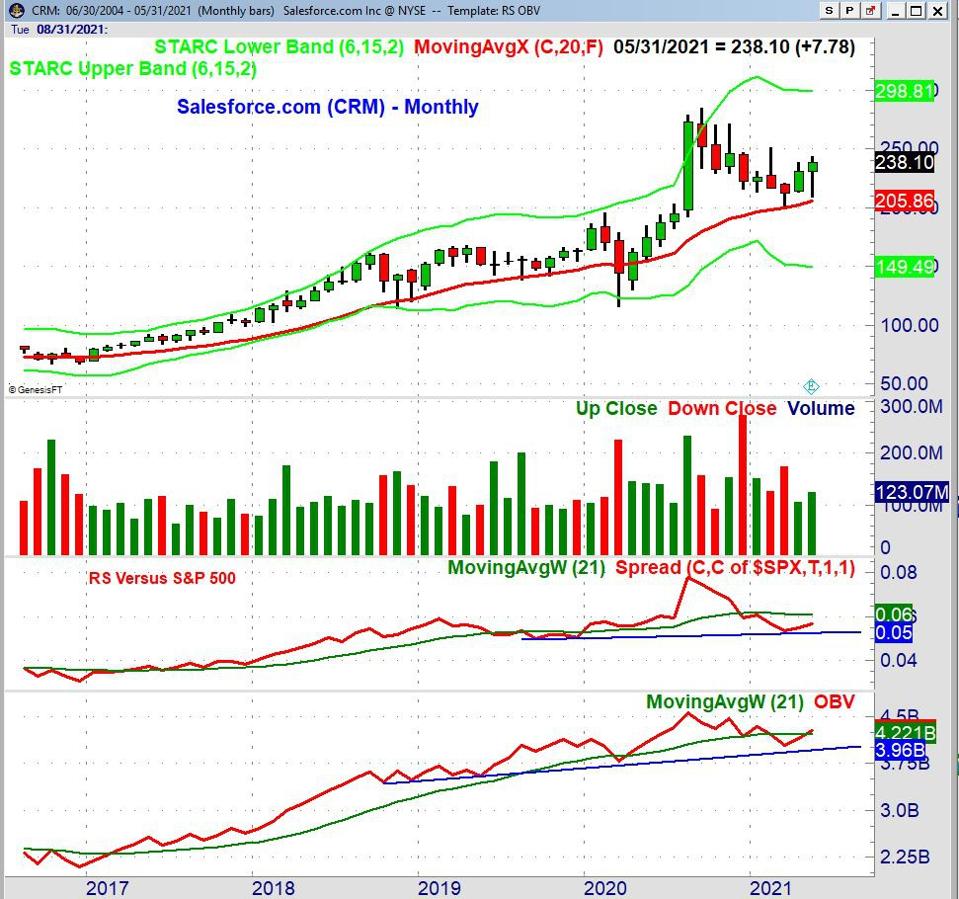
Salesforce.com (CRM) is a fairly well-known software company. It has been correcting since September, when it peaked at $284.50. With the May close at $238.10, it is still down over 16% from its high. It was sharply higher on Friday, gaining 5.4% in reaction to its earnings, as well as the very strong guidance for 2022. It closed well above its daily starc+ band.
CRM had a low in March of $201.51 (point a) as it reached the rising 20-week exponential moving average (EMA), which now stands at $205.86. The correction from the September highs has lasted long enough to change the sentiment on CRM. The February high is at $251.23, and a move above this level will confirm that the correction is over. The monthly starc+ band is at $298.81. CRM opened in May at $230.77 and had a low of $208.91. The monthly pivot for June is at $230.17.
The monthly RS has turned up from support (line b), but is still below its WMA. The weekly RS (not shown) has just closed above its WMA. The OBV has formed a pattern of higher highs since 2018 (see arrow). The monthly OBV held above the long-term support (line c) and closed back above its WMA in May. This is consistent with the end of the correction. The weekly OBV (not shown) is also positive.
The monthly analysis suggests both of these stocks should be higher in the next six months and are likely to overcome the prior all-time highs. The entry point will help determine the risk/reward profile but I would not expect either stock to drop below the May lows. Given Friday’s sharp rally in CRM, I would look for a lower entry point in the next week or two.
If you are interested in learning more about the markets and want specific ETF or stock advice I hope you will consider the Viper ETF Report or the Viper Hot Stocks Report. Reports are released twice a week for only $34.95 each per month.