
General Electric Co. (NYSE: GE) shares were trading lower Tuesday after the company reported worse-than-expected first-quarter sales results. The lower sales caused General Electric to miss the analyst consensus estimate.
General Electric stock was down 3.47% at $13.08 at last check.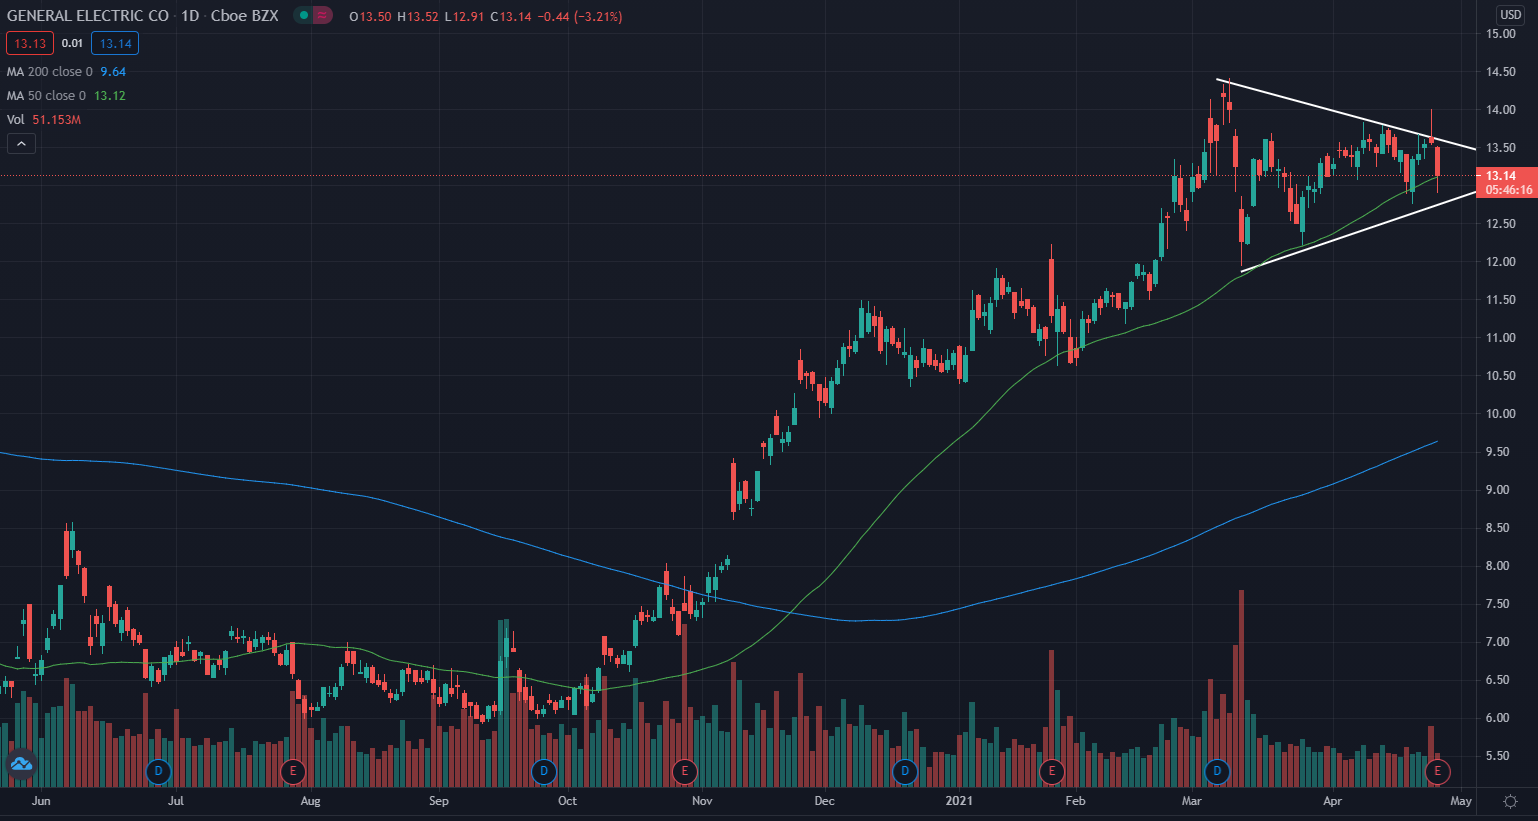
General Electric Daily Chart Analysis
General Electric looks to be forming what technical traders call a pennant pattern.
The stock is trading below the 50-day moving average (green) and above the 200-day moving average (blue), indicating the stock is most likely facing a period of consolidation.
The 50-day moving average may hold as a place of resistance on the chart, and the 200-day moving average is a potential area of support.
Key General Electric Levels To Watch
The stock has been trading sideways the past couple months, forming a pennant pattern.
The pennant pattern forms as the price is condensed between narrowing highs and lows. A strong move in either direction typically follows, and the stock continues trending in the same direction as the breakout.
What’s Next For General Electric?
Bullish technical traders would like to see the stock break out of the pennant pattern and start moving upward. To confirm the breakout of the pennant pattern, traders would like to see the stock cross above the line connecting the highs with some consolidation.
Bearish technical traders would like to see the stock break out of the pattern to the downside. A cross below the line connected by the lows may bring about a large dropoff.
General Electric is a top 10 holding in the Industrial Select Sector SPDR Fund (NSYE:XLI)
(C) 2021 Benzinga.com. Benzinga does not provide investment advice. All rights reserved.