
Overstock Inc. (NASDAQ: OSTK) is trading higher Thursday after the company reported a first-quarter sales beat.
The company netted income of $16.1 million, or 33 cents per share, up from a loss of $16.3 million, or 40 cents per share, in the same period a year ago.
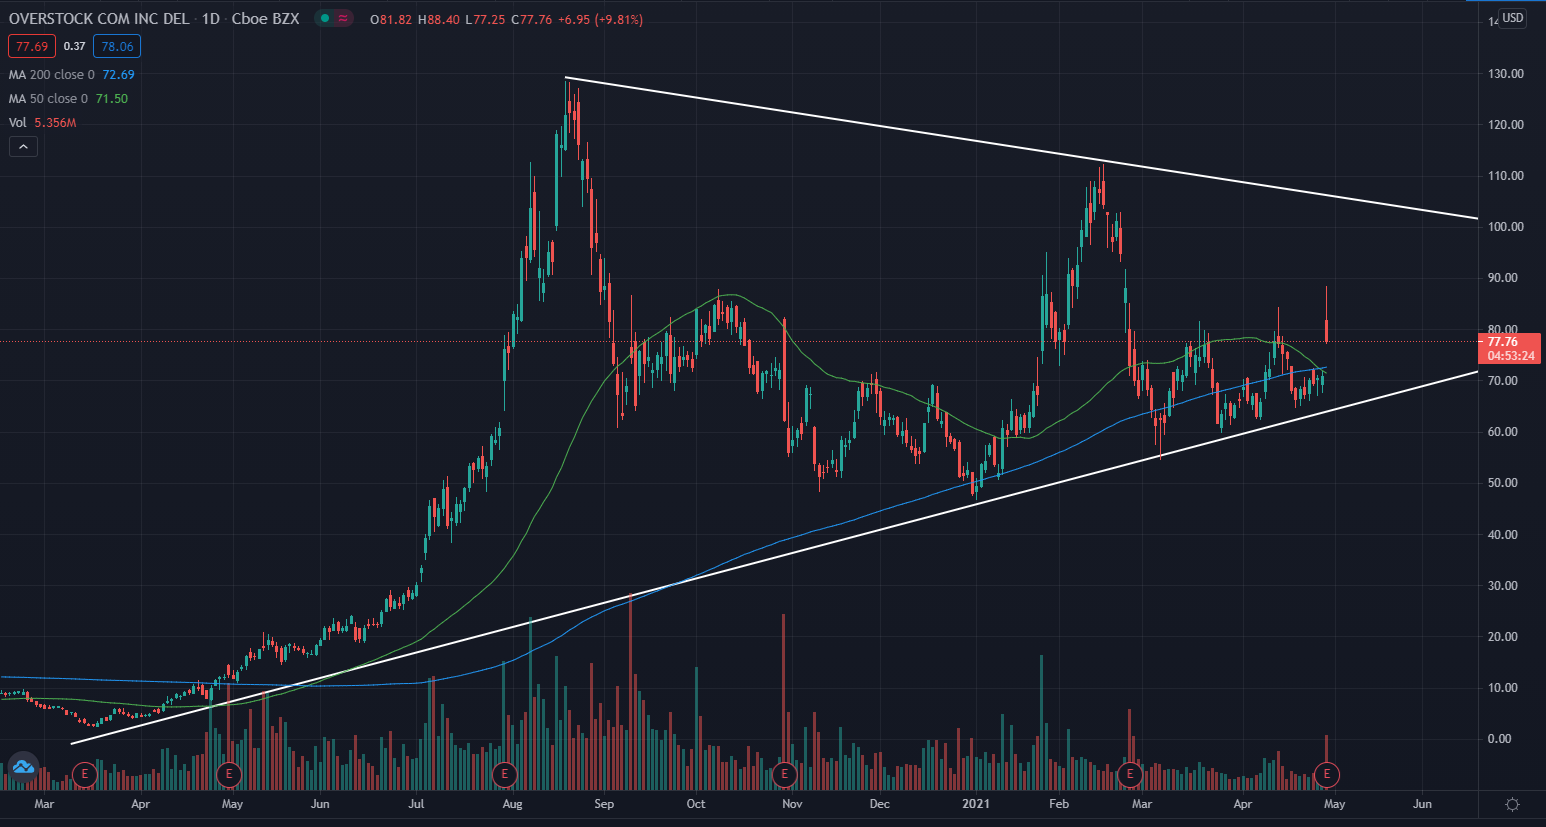
Overstock Daily Chart Analysis
- Overstock is forming into what technical traders may call a pennant pattern.
- The stock is trading above both the 50-day moving average (green) as well as the 200-day moving average (blue). This indicates the stock has had bullish sentiment in recent months.
- The moving averages are areas on the chart that may hold a support level unless the price makes a strong move downward through the averages.
Key Overstock Levels To Watch
- The stock looks to be consolidating into a pattern: connecting the highs and lows together shows the price is getting condensed into the pennant pattern.
- The pennant pattern forms as the price is condensed between narrowing highs and lows. A strong move in either direction typically follows, and the stock continues trending in the same direction as the breakout.
What’s Next For Overstock?
Bullish technical traders would like to see the stock break out of the pennant pattern and start moving upwards. To confirm the breakout of the pennant pattern, traders would like to see the stock cross above the line connecting the highs with some consolidation.
Bearish technical traders would like to see the stock break out of the pattern to the downside. A cross below the line connected by the lows may bring about a large dropoff.
(C) 2021 Benzinga.com. Benzinga does not provide investment advice. All rights reserved.