- Yearn Finance price lumbers higher below the strategically important 200-day simple moving average (SMA).
- Daily volume totals show no commitment to the rebound from the June 22 low of $25,000.
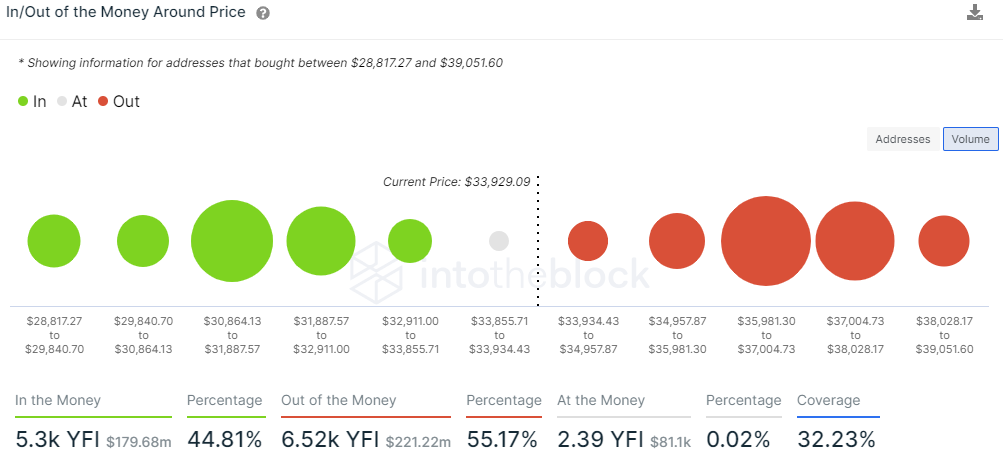
- Based on the In/Out of the Money Around Price (IOMAP), YFI squares off against heavy resistance to the 200-day SMA.
Yearn Finance price did not test the May lows this month and has rebounded from the June 22 low, started by a doji candlestick and continued with a zigzag pattern. The lack of volume and heavy resistance suggests that the YFI rally is corrective and challenged moving forward, leaving little upside to claim.
At the June 22 low, Yearn Finance price was down over 70% from the May 12 high of $94,990, locking in a notable correction after failing to tag the psychologically important $100,000. Like other cryptocurrencies, YFI formed a doji candlestick pattern on June 22 that has evolved into a rebound, including today’s spike above the May declining trend line. The price action today is a constructive development, but bearish headwinds overshadow it.
Currently, Yearn Finance price rests about 10% below the 200-day SMA, a critical determinant of whether the rebound is valid. Suppose YFI can displace the resistance of the trend line on a daily closing basis. In that case, the DeFi token can test the strategically important moving average at $38,153, generating an 11% gain from the current price.
A successful push above the 200-day SMA places Yearn Finance price directly in front of layered resistance, beginning with the convergence of the 2020 high of $43,915 with the declining 50-day SMA at $43,967. The formidable resistance is quickly followed by the anchored VWAP from the November 5 low at $47,830. A rally to the VWAP would yield a 26% gain from the 200-day SMA.
The YFI volume accompanying the bounce will need to spike from current levels to achieve the noteworthy price targets. If not, a rally to the 200-day SMA will be a significant challenge and indicate that the Yearn Finance price jump responds to an oversold technical condition rather than a shift in investor sentiment.
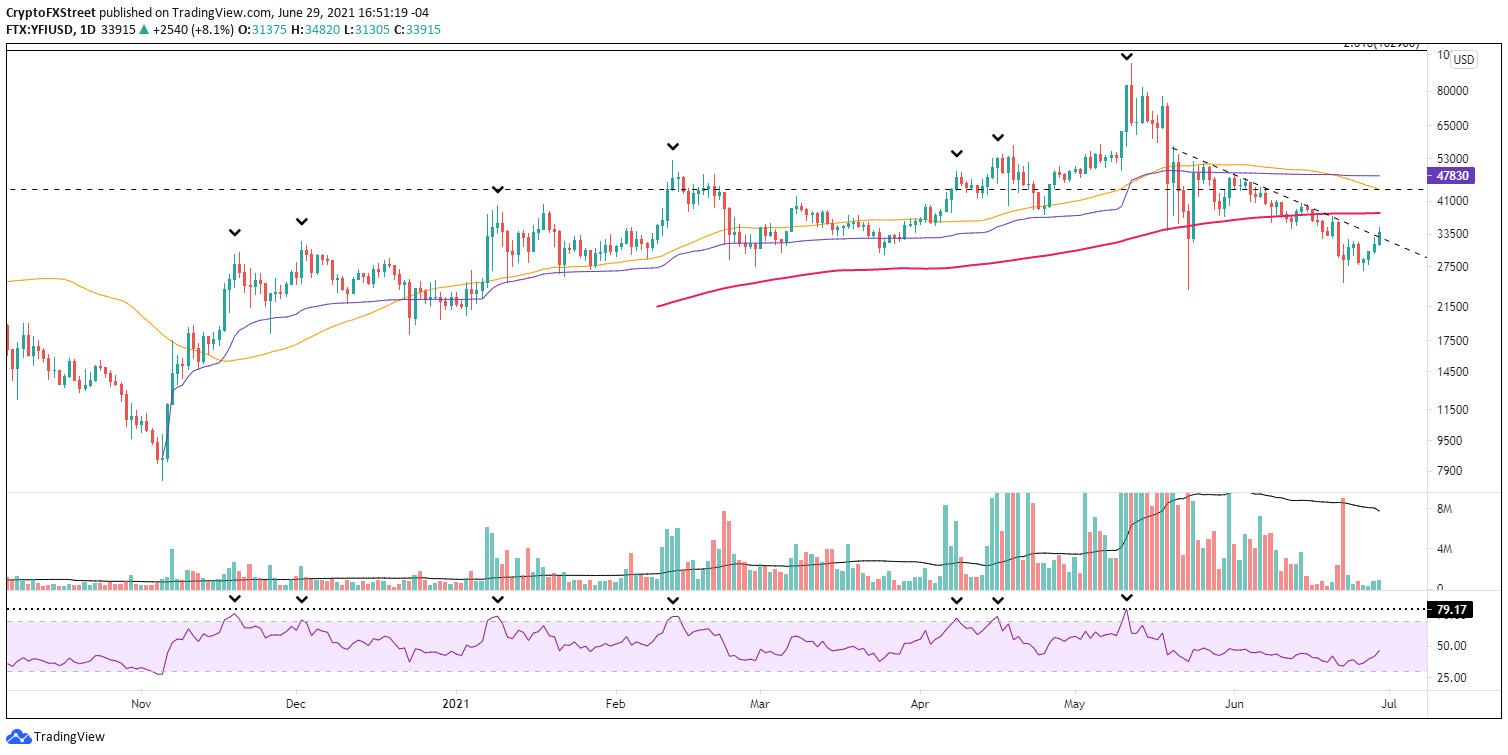
YFI/USD daily chart
If Yearn Finance price holds today’s gains, it will improve the odds for higher prices; however, a failure to maintain leaves YFI exposed to a test of the June 22 low of $25,000 and possibly a sweep of the May 23 low of $23,910 in the short-term.
The next support target for the strongest bears is the December 23, 2020, low of $18,200. An unlikely outcome even if the cryptocurrency market strongly reverses to the downside.
Standing in front of the bullish narrative is the resistance range defined by the IntoTheBlock In/Out of the Money Around Price (IOMAP) metric, from $35,981 to $38,028. The range includes 2.53k addresses holding 4.98K YFI. It sits directly in the path between today’s high and the 200-day SMA, implying that further upside will be a challenge for YFI bullish speculators.
YFI IOMAP – IntoTheBlock
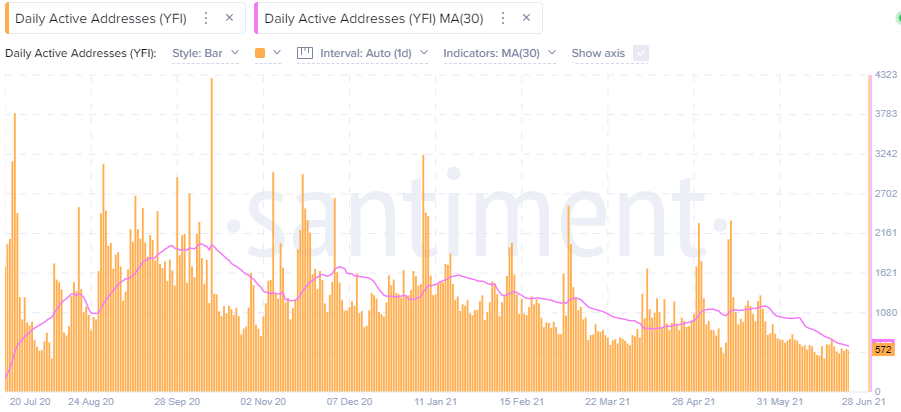
A second bearish observation is the falling social media volume for YFI, as measured by the Santiment Social Volume metric. Social volume considers over 1000 crypto social media channels, including Telegram groups, crypto subreddits, discord groups and private trader’s chats.
Interestingly, YFI social volume, based on the 30-day SMA, is at the lowest level since July 2020. The metric never rebounded after the May 23 low, revealing disinterest in the DeFi project that has only continued today. More plainly, speculators are now finding value at the current Yearn Finance price.
Additionally, a rebound in the cryptocurrency market without a gradual uptick in social media interest gets tougher, particularly when major technical obstacles are involved.
YFI Social Volume – Santiment
It is easy to become attracted to the double-digit gains for Yearn Finance price today. Still, when considered from a technical and on-chain perspective, YFI is beyond a secure investment opportunity. For now, the upside is likely capped at the 200-day SMA or a 10% gain from the current price.