After witnessing good two-way businesses on Thursday, Gold (XAU/USD) is holding on to recent recovery gains amid a broadly subdued US dollar and higher Treasury yields. The returns on the US debt surged after the country’s annualized GDP beat estimates with 6.4% in Q1 2021 while the weekly jobless claims hit the pandemic low. Higher yields dull gold’s attractiveness as a non-yielding investment asset.
Although the metal’s downside appears cushioned amid US President Joe Biden’s $1.8 trillion social stimulus package alongside his infrastructure spending plan.
How is gold positioned on the charts?
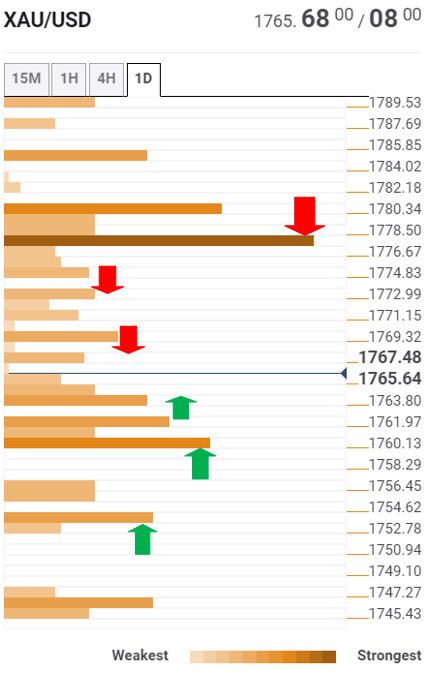
The Technical Confluences Detector shows that gold is likely to face immediate support at the previous week low of $1764.
The bears will then target the confluence of the pivot point one-week S1, the previous month high and Bollinger Band one-day Middle around $1761.
A firm break below the latter could expose the pivot point one-month R1 at $1753. That level is critical support, which the XAU bulls need to defend to stall the bearish momentum.
On the flip side, the buyers need to find acceptance above the resistance zone around $1768-$1770, which is the convergence of the Fibonacci 38.2% one-day, previous high one-hour and Bollinger Band four-hour Lower.
Further up, a bunch of minor hurdles is aligned near the $1774 region, where the SMA50 four-hour coincides with the previous high four-hour.
Powerful resistance at $1777 will be a tough nut to crack for the XAU bulls on the road to recovery. At that point, SMA100 one-hour, the Fibonacci 61.8% one-week and one-day intersect.
The TCD (Technical Confluences Detector) is a tool to locate and point out those price levels where there is a congestion of indicators, moving averages, Fibonacci levels, Pivot Points, etc. Knowing where these congestion points are located is very useful for the trader, and can be used as a basis for different strategies.