
- AAPL shares continue to struggle after blowout earnings.
- Apple suffering as the tech sector turns bearish.
- Nasdaq: AAPL increases dividend and buyback, but bears still winning.
Apple shares again traded lower on Tuesday as a retail rally failed to do much for the big tech names. Despite the Nasdaq rallying strongly from its opening print, it still finished in negative territory and so did most of the FAANG names. Apple shares closed at $125.91 a loss of 0.74%. It was looking very ugly early in the session as AAPL opened below the 100-day moving average, hitting a $122 handle before buyers stepped in.
AAPL shares have not had the reaction many would expect to a truly stellar earnings release. Apple made most Wall Street analysts look like rookie horse pickers when it smashed analyst estimates for Q1. AAPL earnings date was April 28, but the stock closed lower despite the earnings beat. Earnings per share was reported at $1.40 versus the average analyst forecast of $0.99. A forty percent beat.
AAPL shares were trading at $131 at the time of reporting earnings, popped up to $137 before gradually sliding back to $125.
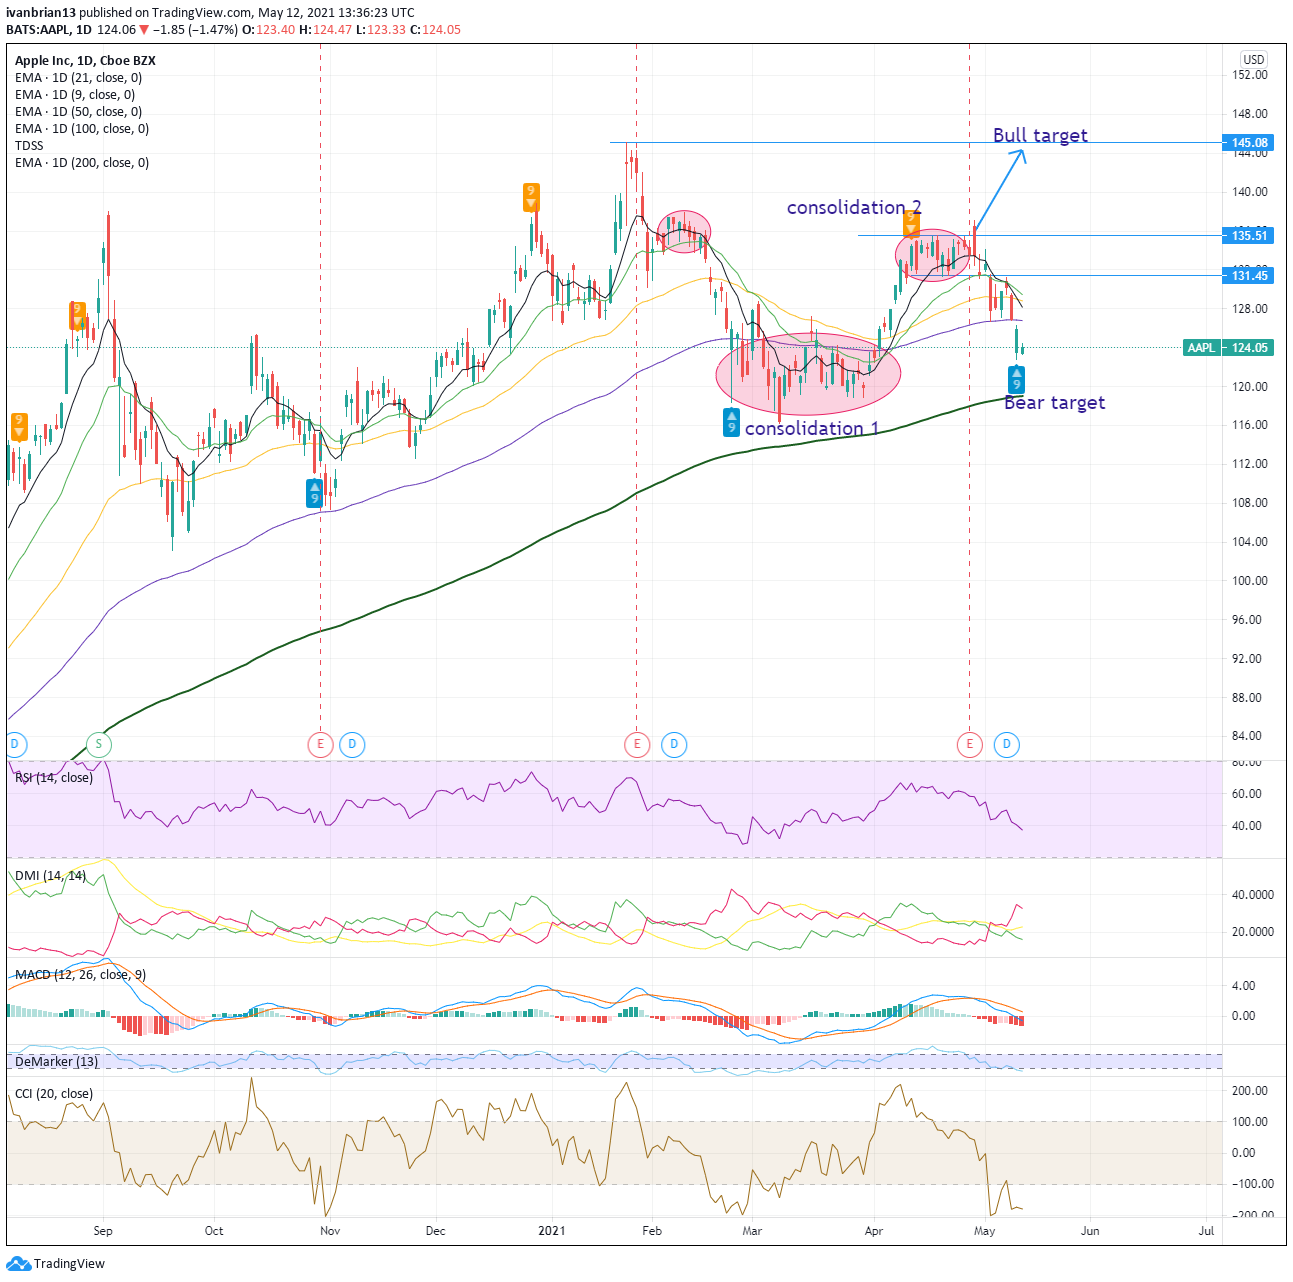
AAPL looks bearish on the chart and is suffering as high valuation growth and tech stocks get sold off. AAPL is neither high growth nor high valuation. It is quite simply a stellar company with amazing balance sheet fundamentals. However, for now we have to follow what the chart presents us, and that is a bearish picture. The target to reverse this bearishness is to get back above Monday’s low print of $126.81. This will close a gap on the chart and regain the 100-day moving average, so a nice confluence of indicators. From there AAPL would start to look better and probably consolidate before testing $131.45. Then onto $135.51, $145.08 and to the moon as our new meme friends say.
Failure means we keep the bearish trend and target the consolidation 1 area, which AAPL had a brief spike to on Tuesday before being rejected. This range of $124-$118 will likely hold or slow the descent and can be a long entry point for a bounce. It also incorporates the 200-day moving average, a nice confluence of support indicators. A break lower would see $103-$107 as the next support area. This area is the low from September and October 2020.
At the time of writing, the author has no position in any stock mentioned in this article and no business relationship with any company mentioned. The author has not received compensation for writing this article, other than from FXStreet.
This article is for information purposes only. The author and FXStreet are not registered investment advisors and nothing in this article is intended to be investment advice. It is important to perform your own research before making any investment and take independent advice from a registered investment advisor.
FXStreet and the author do not provide personalized recommendations. The author makes no representations as to accuracy, completeness, or the suitability of this information. FXStreet and the author will not be liable for any errors, omissions or any losses, injuries or damages arising from this information and its display or use. The author will not be held responsible for information that is found at the end of links posted on this page.
Errors and omissions excepted.