
- BABA shares outperform the main market, fall a modest 0.55%.
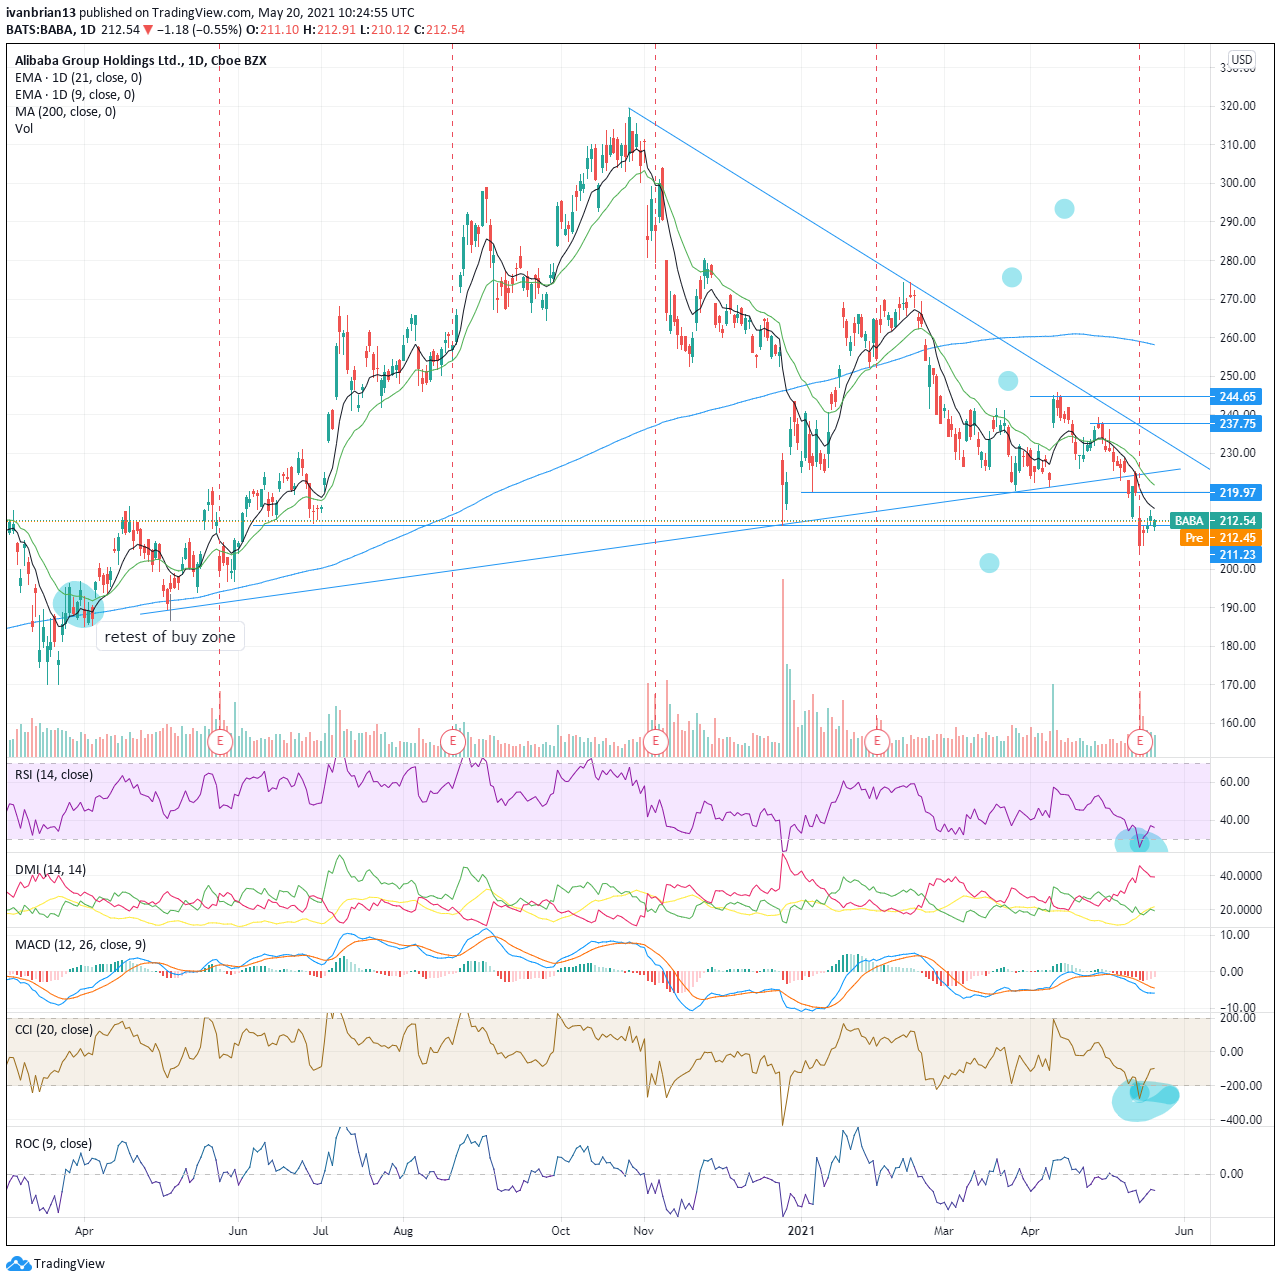
- BABA holds a key support level at $211.23.
- RSI and CCI had shown up as oversold on May 13.
Alibaba shares traded quite well on Wednesday in a nervous and weak overall market. The bitcoin crash had spooked retail investors and quite a number of retail meme stocks suffered steep falls. AMC dropped 10%, GME 6.5% so the performance of Alibaba was actually not bad in relative terms. BABA shares closed at $212.54, a loss of 0.55%.
Stay up to speed with hot stocks’ news!
Alibaba (BABA) is the Chinese Amazon (AMZN), and with China being a country of nearly 1.5 billion people, that is an impressive marketplace.
BABA is one of China’s most successful internet companies and has a similar business model to Amazon with an online retail marketplace, a cloud business and a stake in a fintech e-payments business called ANT Group. ANT Group was due to IPO in late 2020 but was pulled at the last minute after BABA and ANT founder Jack Ma gave a speech in which he appeared to criticize Chinese regulators and the banking industry. The IPO (Initial Public Offering) was canceled, and BABA’s share price struggled, losing over 30% of its value.
Alibaba (BABA) reported first-quarter 2021 results before the open on Thursday, May 13. Revenue for the quarter was 187.395 billion yuan, an increase of 64% and ahead of the forecasted 180.41 billion yuan. The quarterly net loss was 7.6 billion yuan due to a fine from the Chinese regulator. Earnings per share adjusted (EPS) were $1.58, missing the $1.78 estimate.
BABA shares had traded in a large triangle formation and broke out to the downside on May 7. This was a bearish signal with $211.23 as the next support level to target. It also ended the series of higher lows and so looks to be a bearish breakout. This level, $211.23, was also broken as the market reacted poorly to the earnings number on Thursday, May 13. BABA shares closed down over 6% after the earnings release. Investors focused on the loss, which was attributable to a fine from Chinese regulators. This is a source of continuous concern. Post earnings release, Keybanc and Raymond James lowered their price targets, while Cathie Wood of ARK Invest fame sold stock.
The stock has since stabilized and recaptured the key $211.23 support/resistance level. Volume on the results day was high but volume quickly dropped off signalling that the move did not have a lot of momentum behind it. Reports from Bloomberg that Chinese e-commerce platform Huitongda Network is to seek a $1 billion Hong Kong IPO may have helped turn investor sentiment. Alibaba is a backer of Huitongda.
For now the trend is still bearish until $219.97 is broken, but both the Relative Strength Index (RSI) and Commodity Channel Index (CCI) have flagged oversold conditions on Tuesday, so it is better to watch for a retrace. First move above the 9-day moving average at $215 and then target $219.97.
A sustained break of $211.23 will bring $189.53 as the next target. At $189.53 there is a small support zone here (highlighted in blue), and this may be a place to initiate a long position if you are so biased. Basically, a support zone is where the price has appreciated, stabilized and then appreciated again. The logic is the price has moved up, stalled but not fallen. More buyers have powered through any sellers and taken the price higher. Basically, it is a consolidation zone but confirms the trend. In this case, the zone was retested in early May 2020 before buyers again pushed BABA out of the zone.
| Support | Resistance |
| 211.23 | 219.97 |
| 189.53 | 224.65 |
| 170 | 227.30 |
| 230 | |
| 237.10 | |
| 242-244 | |
| 274.29 |
At the time of writing, the author has no position in any stock mentioned in this article and no business relationship with any company mentioned. The author has not received compensation for writing this article, other than from FXStreet.
This article is for information purposes only. The author and FXStreet are not registered investment advisors and nothing in this article is intended to be investment advice. It is important to perform your own research before making any investment and take independent advice from a registered investment advisor.
FXStreet and the author do not provide personalized recommendations. The author makes no representations as to accuracy, completeness, or the suitability of this information. FXStreet and the author will not be liable for any errors, omissions or any losses, injuries or damages arising from this information and its display or use. The author will not be held responsible for information that is found at the end of links posted on this page.
Errors and omissions excepted.