

AUD/USD, AUS 200, Iron Ore Analysis
Measured approach from the RBA sees the Aussie head lowerIron ore prices hold up for now, potential head and shoulders reversal pattern emergingAUS 200 index edges higher on weaker AUD and positive earnings reportsThe analysis in this article makes use of chart patterns and key support and resistance levels. For more information visit our comprehensive education library
Measured Approach by RBA sees the Aussie Trade Lower
The Reserve Bank of Australia (RBA) decided to keep rates on hold earlier this month, flagging a slowing economy and relatively calm inflation as the main reasons for holding rates steady. The balanced message also cited that further tightening of “clearly restrictive” rates may be required.
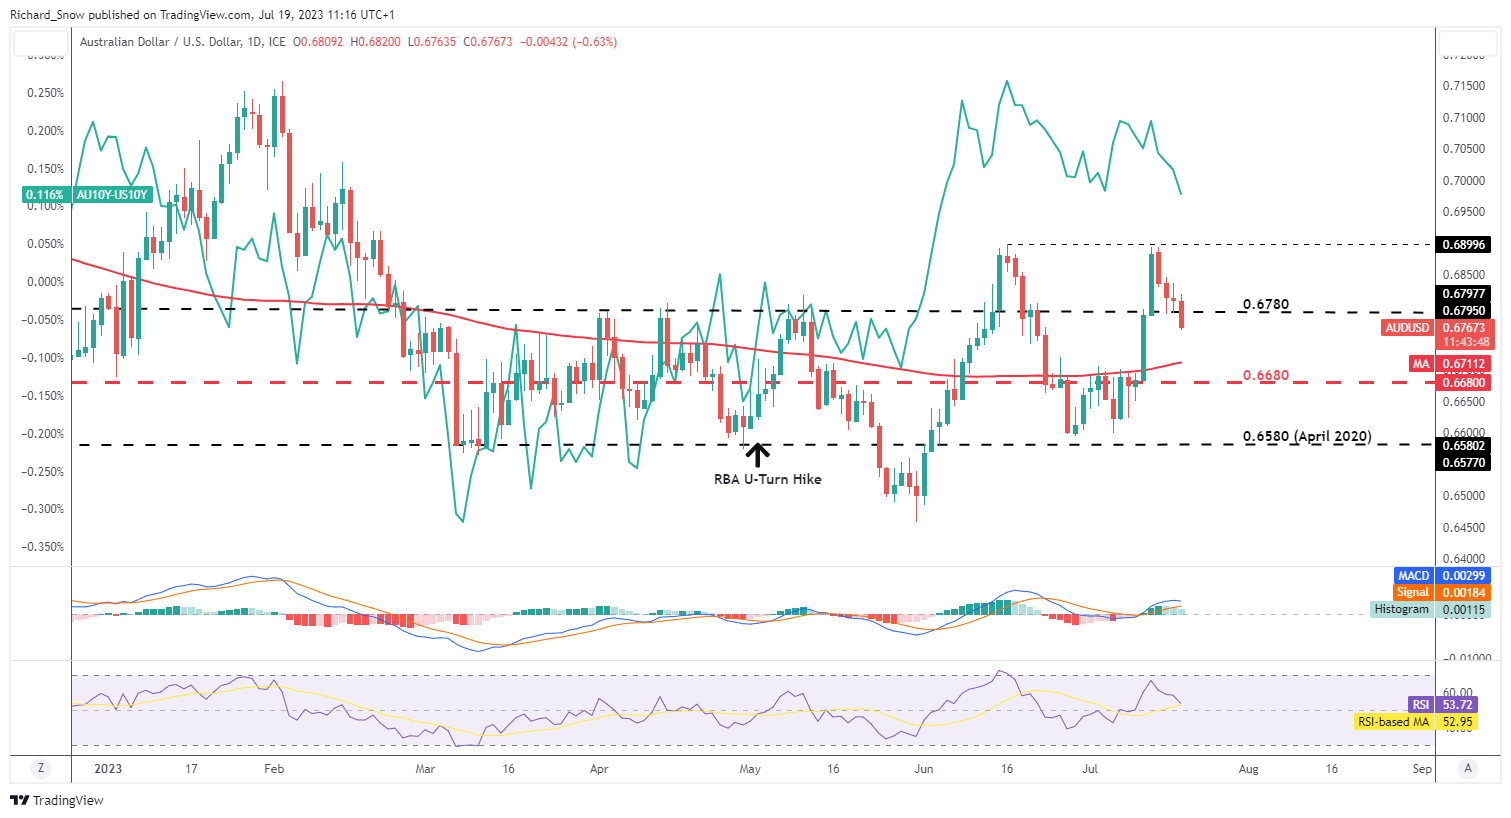
AUD/USD appears to be unwinding the effects of the sharp USD selloff, retracing around half of the prior move. Today, prices trade below the prior influential 0.6780 level, where a close below here eyes the 200 simple moving average (SMA) and 0.6680 which has coincidentally acted as the mid-line of the broader trading range that had largely contained price action since March this year.
The green line denotes the differential between the 10 year Australian and US government bond yields, which retains a notable correlation with unfolding price action. With the RBA on hold for now and the US anticipating another 25 basis point hike next week, further AUD/USD declines cannot be ruled out.
AUD/USD Daily Chart
Source: TradingView, prepared by Richard Snow
Fundamentals for the Aussie have deteriorated as China’s appetite for industrial metals has cooled. The Asian nation grapples with reopening the economy during a global growth slowdown, evidenced by Q2 data reported at the start of this week which revealed weaker than expected growth.
Iron Ore Prices Hold up, but for how long?
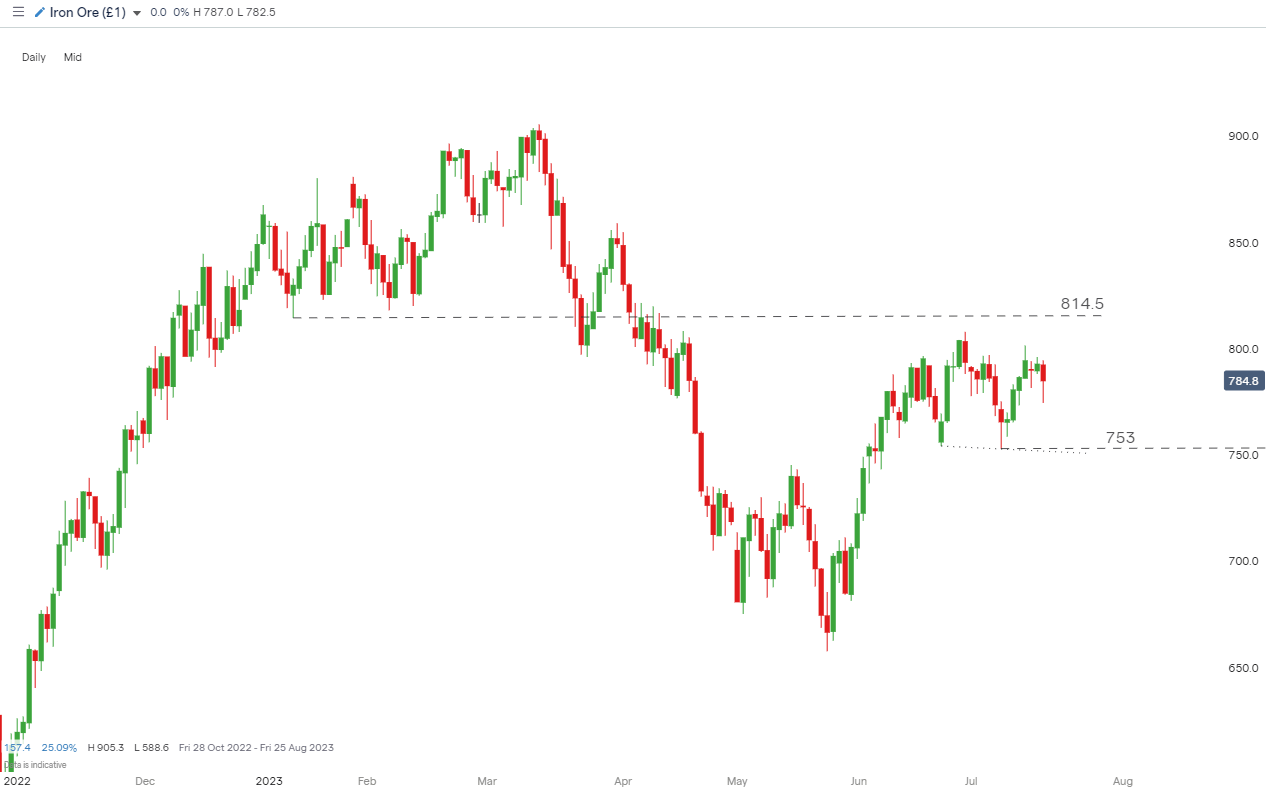
Prices for iron ore, Australia’s main export have actually held up recently but the emergence of a potential head and shoulders reversal patters threatens the status quo. Since Australia’s economic prosperity is closely tied to that of China, it makes sense to monitor scheduled event risk for both countries. Read more about the connection between Australia and China via the core-perimeter relationship.
Iron Ore Daily Chart, IG
Source: IG, prepared by Richard Snow
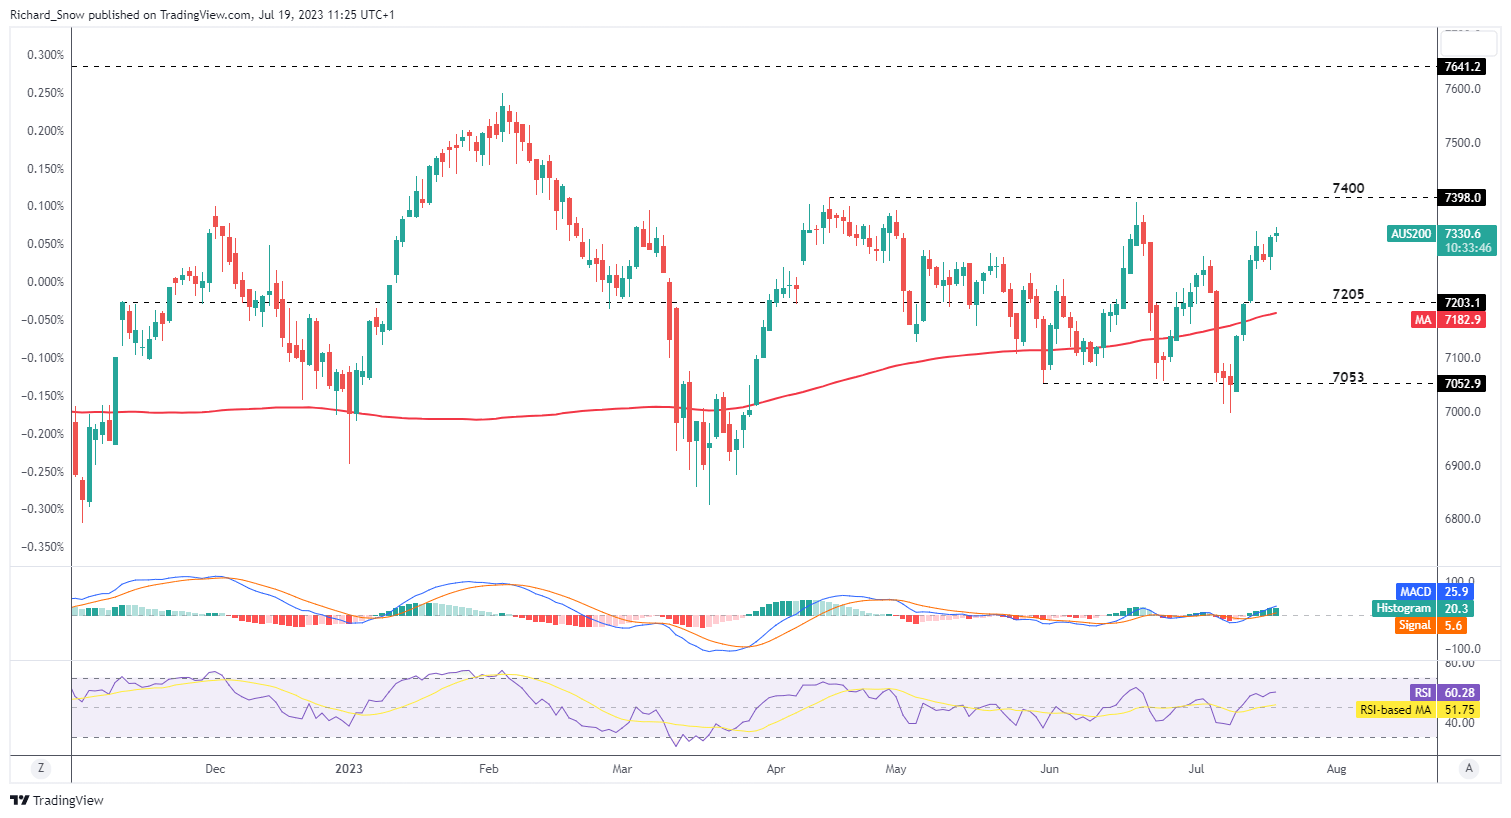
The ASX 200 index trades slightly higher today, on the back of a great trading week and positive US earnings reports which have been effective in maintaining global risk appetite. The declining Aussie dollar is likely to provide support for the index. After US market close today, Netflix and Tesla are due to release their second quarter trading updates – providing insight into the first of the traditional ‘big tech’ stocks. Resistance lies at 7400 with support at 7205. Bolstering 7205 is the 200 SMA.
ASX 200 Daily Chart
Source: TradingView, prepared by Richard Snow
— Written by Richard Snow for DailyFX.com
Contact and follow Richard on Twitter: @RichardSnowFX

