
- BABA reports results on Thursday before the market opens.
- BABA expected to report earnings per share of $1.78.
- BABA shares under pressure as regulatory concerns still weigh on sentiment.
Alibaba (BABA) is the Chinese Amazon (AMZN) and with China being a country of nearly 1.5 billion people, that is an impressive marketplace.
BABA is one of China’s most successful internet companies and has a similar business model to Amazon with an online retail marketplace, a cloud business, and a fintech e-payments business called ANT Group. ANT Group was due to IPO in late 2020 but was pulled at the last minute after BABA and ANT founder Jack Ma gave a speech in which he appeared to criticize Chinese regulators and the banking industry. The IPO (Initial Public Offering) was canceled, and BABA’s share price struggled, losing over 30% of its value.
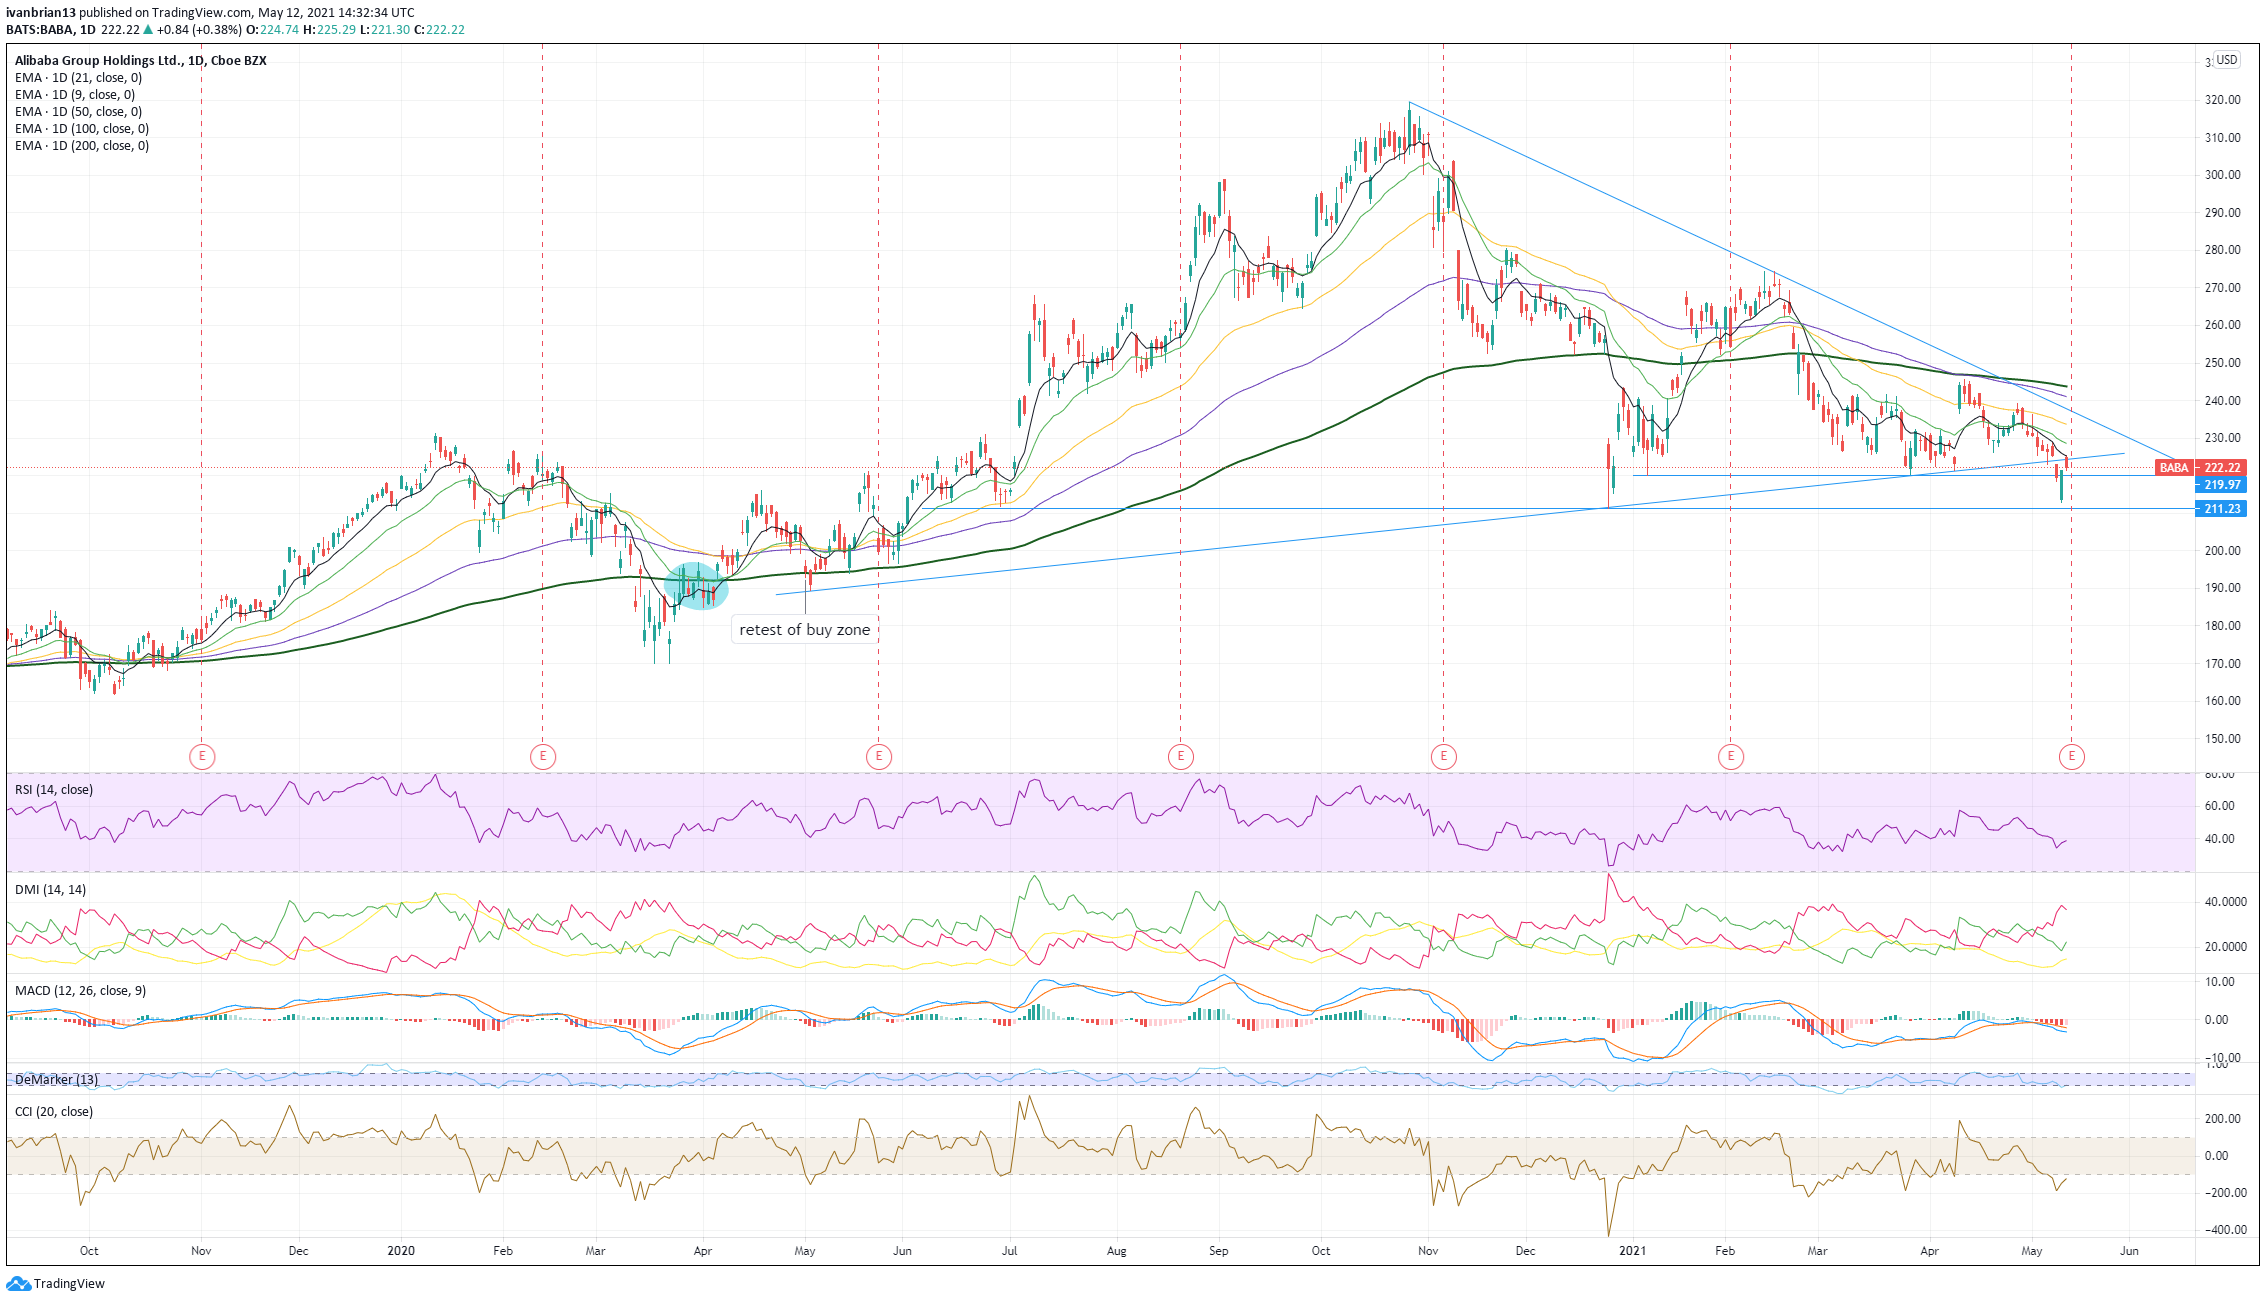
Alibaba shares broke trendline support on Monday and Tuesday and are looking increasingly ugly. $219.97 was broken, meaning $211.23 is the next support level to target. Right now BABA is at a pivot point, retracing up to the 9-day moving average at $225.20 and trendline resistance at $224. So as the time of writing on Wednesday, BABA is at a strong resistance level, the confluence of the 9-day MA and trendline. If BABA breaks higher the target is $237.10, the top trendline.
However, the overall picture still looks bearish. Relative Strength Index (RSI) and Commodity Channel Index (CCI) are trending lower so confirming the price trend. The Moving Average Convergence Divergence (MACD) is crossed into a bearish signal. More importantly, the series of bullish higher lows has now also been broken.
A break of $211.23 is likely and will bring $189.53 as the next target. There is a small buy zone here (highlighted in blue) so that may be a place to initiate a long position. Basically, a buy zone is one where the price has appreciated, stabilized, and then appreciated again. The logic is the price has moved up, stalled but not fallen. More buyers have powered through any sellers and taken the price higher. Basically a consolidation zone but confirming the trend. In this case, the zone was retested in early May 2020 before buyers again pushed BABA out of the zone.
To turn bullish, BABA needs to break back above the lower trend line and break the 9 and 21-day moving averages. This will then target the upper trend line at $237.10.
| Support | Resistance |
| 219.97 | 224.65 |
| 211.23 | 227.30 |
| 189.53 | 230 |
| 170 | 237.10 |
| 242-244 | |
| 274.29 |
BABA releases Q1 results on Thursday, May 13 before the open. Earnings per share are expected to be $1.80 on revenue of $27.52 billion.
At the time of writing, the author has no position in any stock mentioned in this article and no business relationship with any company mentioned. The author has not received compensation for writing this article, other than from FXStreet.
This article is for information purposes only. The author and FXStreet are not registered investment advisors and nothing in this article is intended to be investment advice. It is important to perform your own research before making any investment and take independent advice from a registered investment advisor.
FXStreet and the author do not provide personalized recommendations. The author makes no representations as to accuracy, completeness, or the suitability of this information. FXStreet and the author will not be liable for any errors, omissions or any losses, injuries or damages arising from this information and its display or use. The author will not be held responsible for information that is found at the end of links posted on this page.
Errors and omissions excepted.