- Binance Coin price has formed a massive bull flag on the daily chart.
- The digital asset faces just one critical resistance level before a huge 65% breakout to new all-time highs.
- BNB could see a bearish breakdown in the short term.
Binance Coin price has seen a significant recovery in the last 48 hours as the entire market gained more than $100 billion in market capitalization back.
On the daily chart, BNB has formed a bull flag and could be close to a massive breakout. The most significant resistance level is formed at the psychological point of $600.
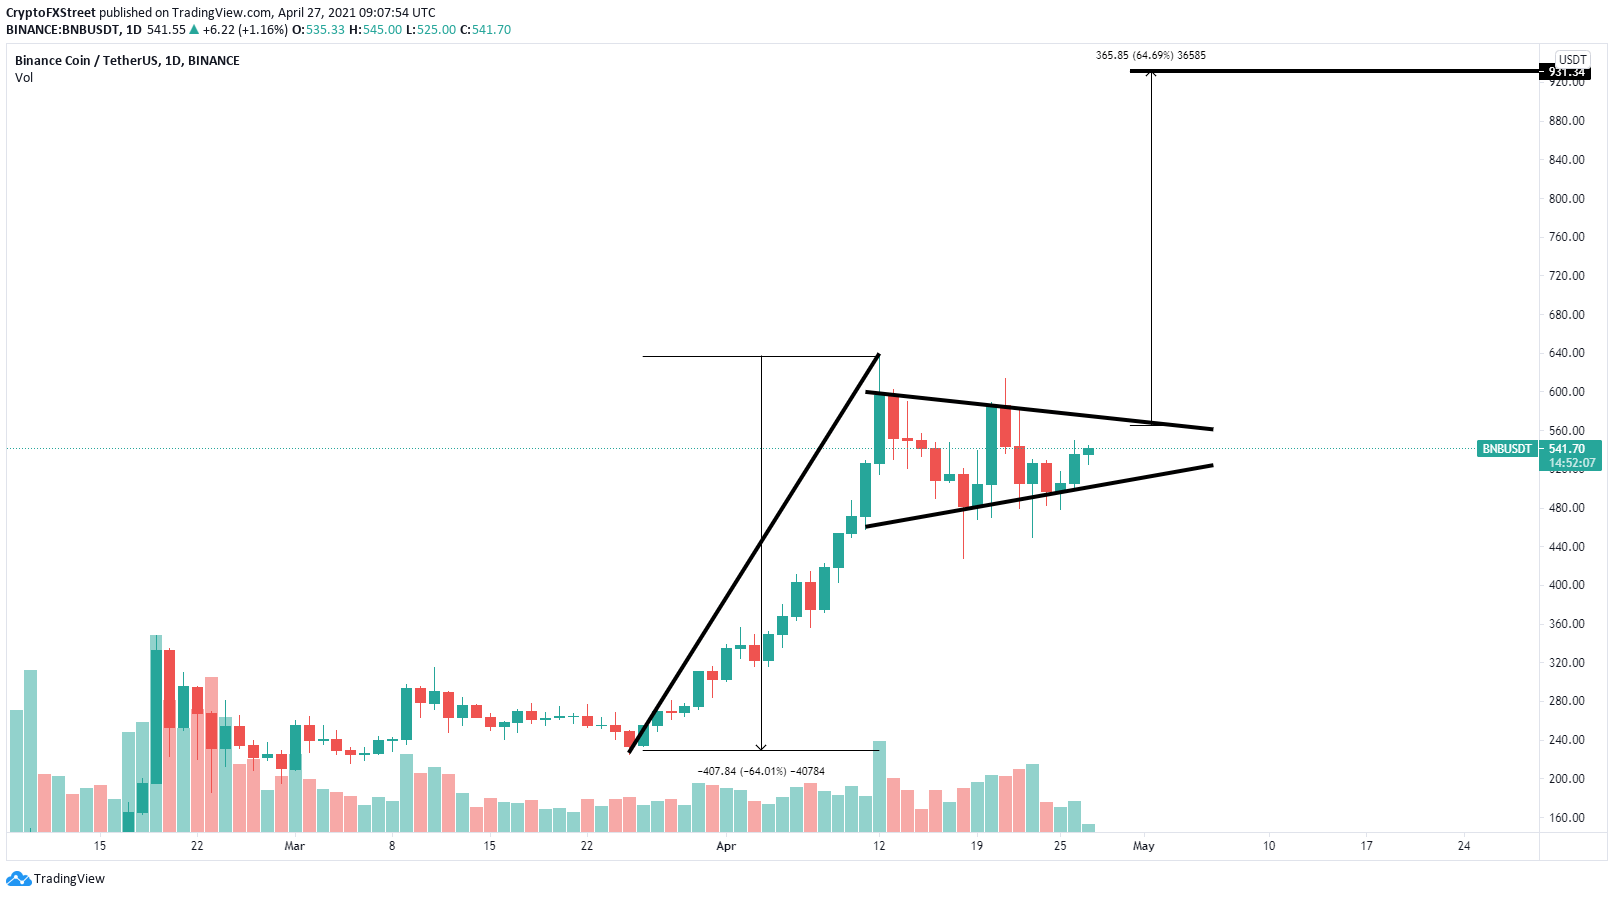
BNB/USD daily chart
A breakout above this key level has a 65% price target at $930. This target is calculated by using the height of the pole as a reference point.
However, Binance Coin price is also trading inside an ascending triangle pattern formed on the 6-hour chart. The TD Sequential indicator has presented a sell signal here in the form of a green ‘9’ candlestick.
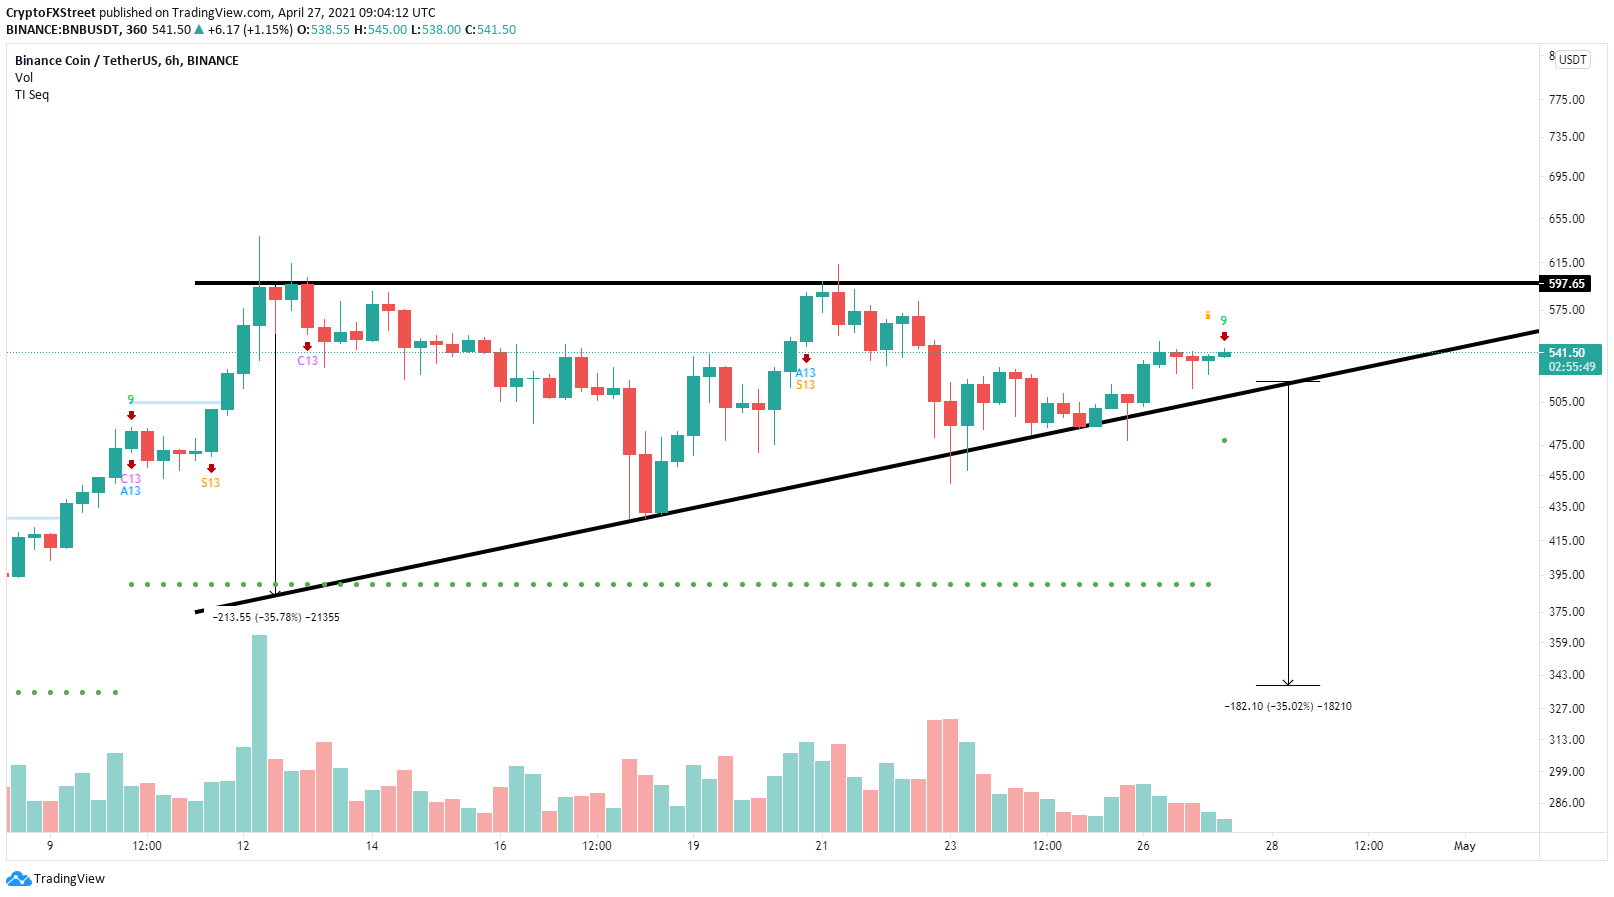
BNB/USD 6-hour chart
The most significant trend line support is formed at $514. A breakdown below this point, impulsed by the sell signal, would drive Binance Coin price down to $340 in the longer term.