
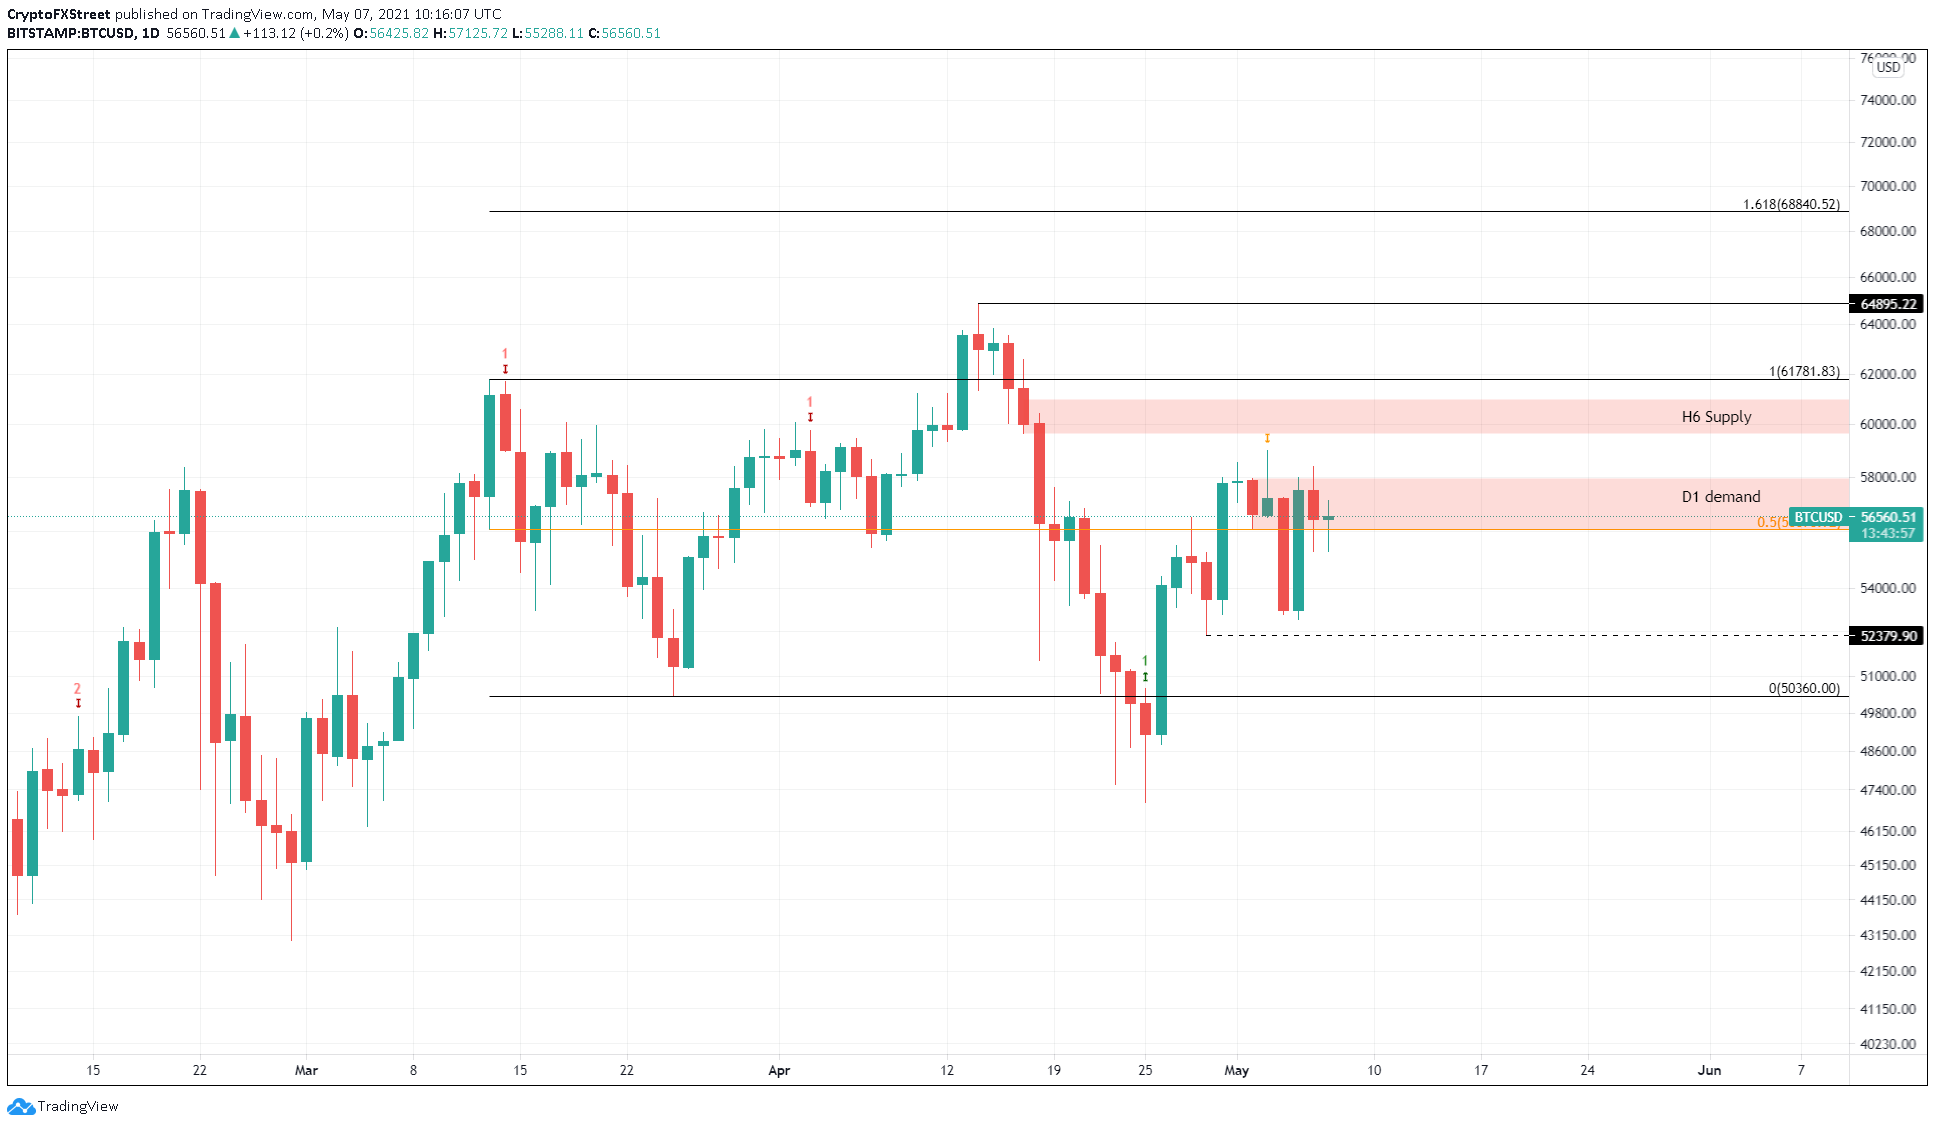
Bitcoin price faces a stiff resistance wall that has prevented weak bullish momentum from passing through. As a result, a short-lived retracement has caused a majority of the market to follow suit despite BTC’s raging adoption and interest from institutions over the past week.
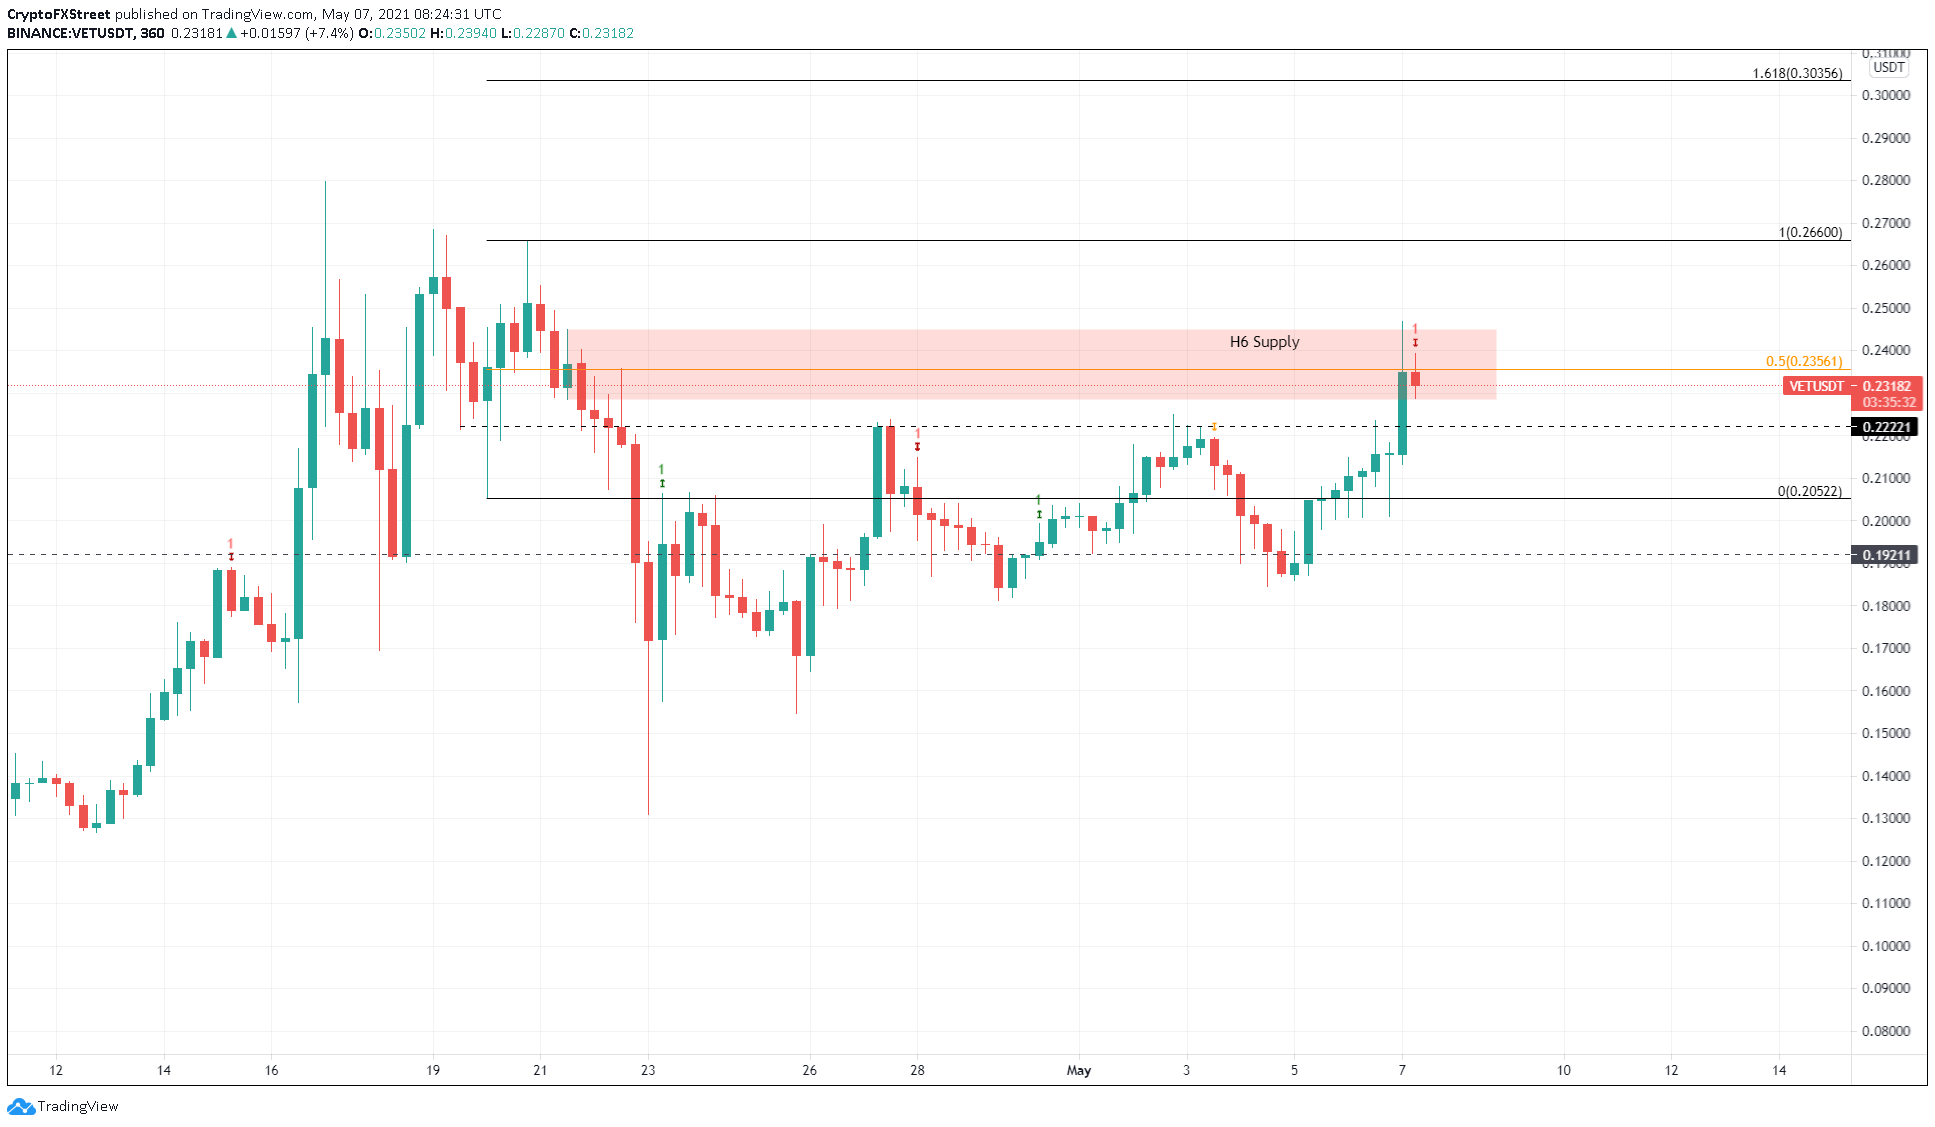
VeChain price shows an ambiguous outlook as it has set up a textbook uptrend with a series of higher highs and higher lows, but technical indicators hint at a downtrend.
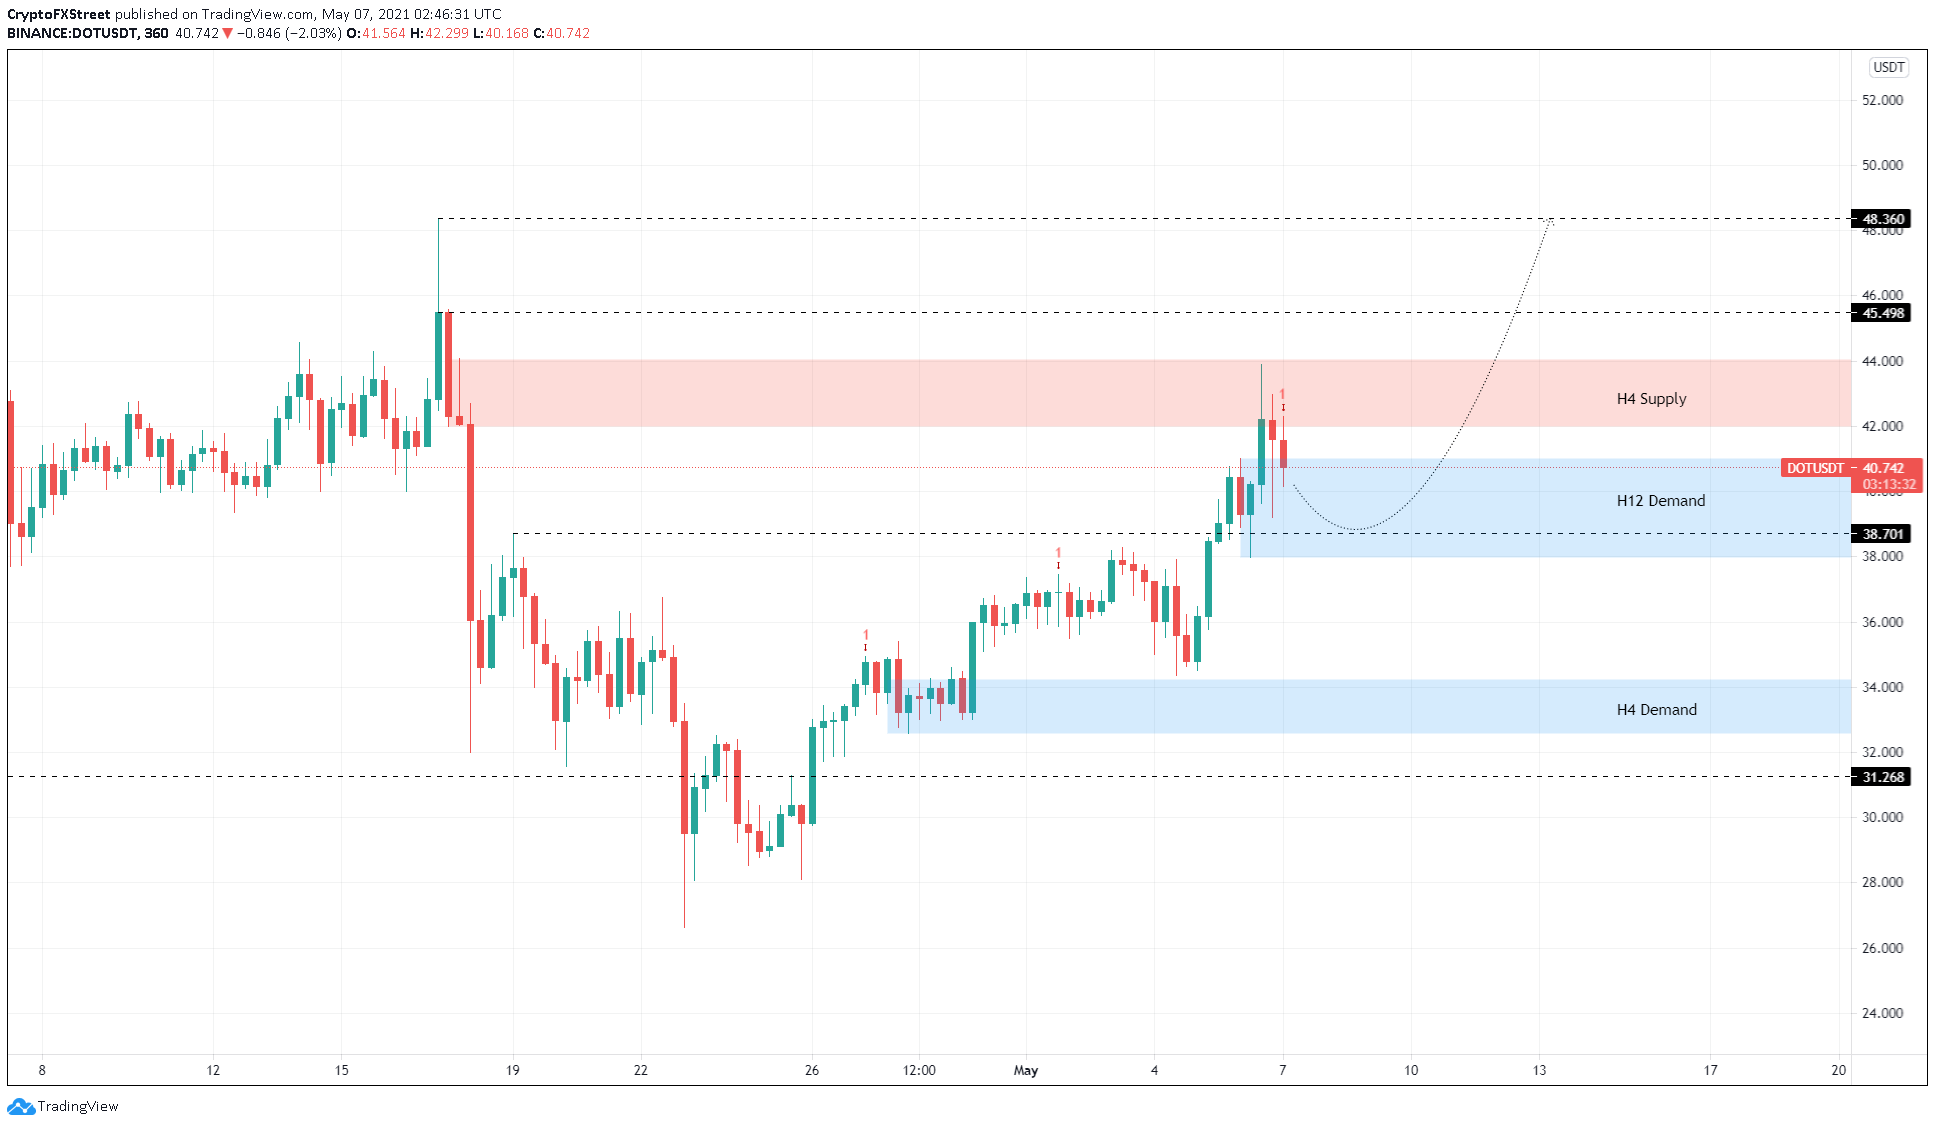
Polkadot price shows a slowdown in its bullish momentum that has resulted in sellers taking over. Now, a minor retracement could push DOT into a significant support barrier.
Information on these pages contains forward-looking statements that involve risks and uncertainties. Markets and instruments profiled on this page are for informational purposes only and should not in any way come across as a recommendation to buy or sell in these assets. You should do your own thorough research before making any investment decisions. FXStreet does not in any way guarantee that this information is free from mistakes, errors, or material misstatements. It also does not guarantee that this information is of a timely nature. Investing in Open Markets involves a great deal of risk, including the loss of all or a portion of your investment, as well as emotional distress. All risks, losses and costs associated with investing, including total loss of principal, are your responsibility. The views and opinions expressed in this article are those of the authors and do not necessarily reflect the official policy or position of FXStreet nor its advertisers.