

Developments on higher timeframe charts suggest the recent rebound is not a sign of the resumption of the multi-week uptrend. Indeed, chances are that cryptocurrencies could be settling in a range in the interim.
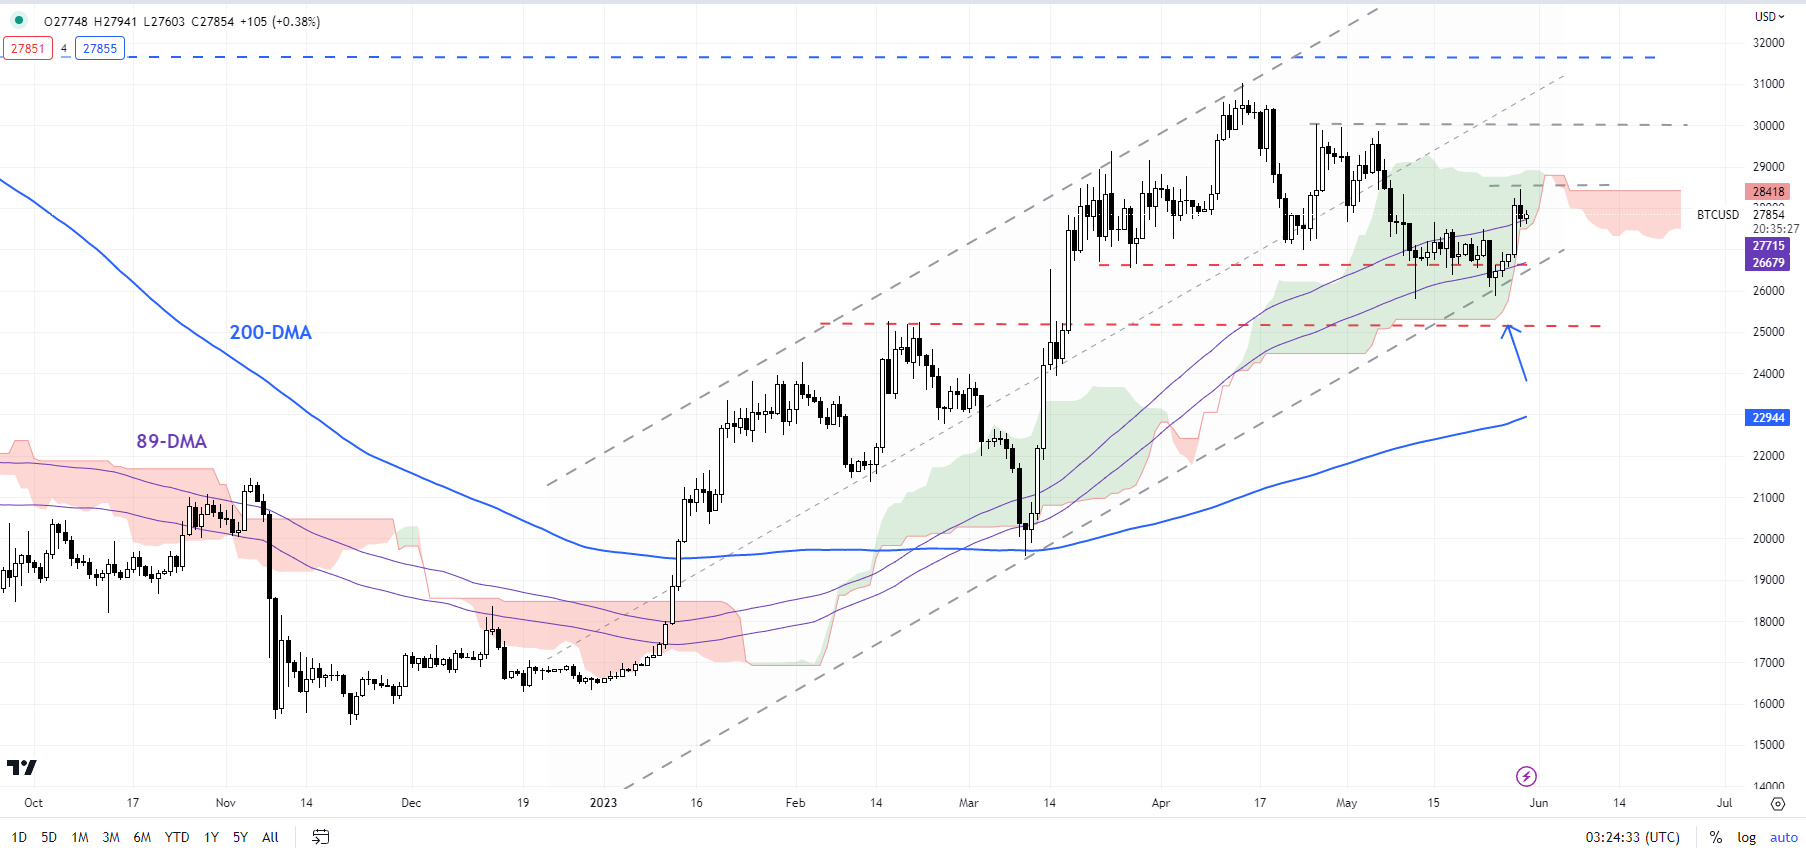
BTC/USD Daily Chart
Chart Created by Manish Jaradi Using TradingView
BITCOIN: Consolidation within the uptrend
BTC/USD has managed to hold above quite strong converged support around 25300-26000 (including the 89-day moving average and the February 2023 high), highlighted in the previous update. See “Bitcoin & Ethereum Week Ahead: Cracks in the Rally?”, published May 15. The rise on Monday above the initial cap at the mid-May high of 27675 has reduced the downward pressure somewhat. However, unless BTC/USD clears the 30000 mark, the path of least resistance is sideways to slightly down.
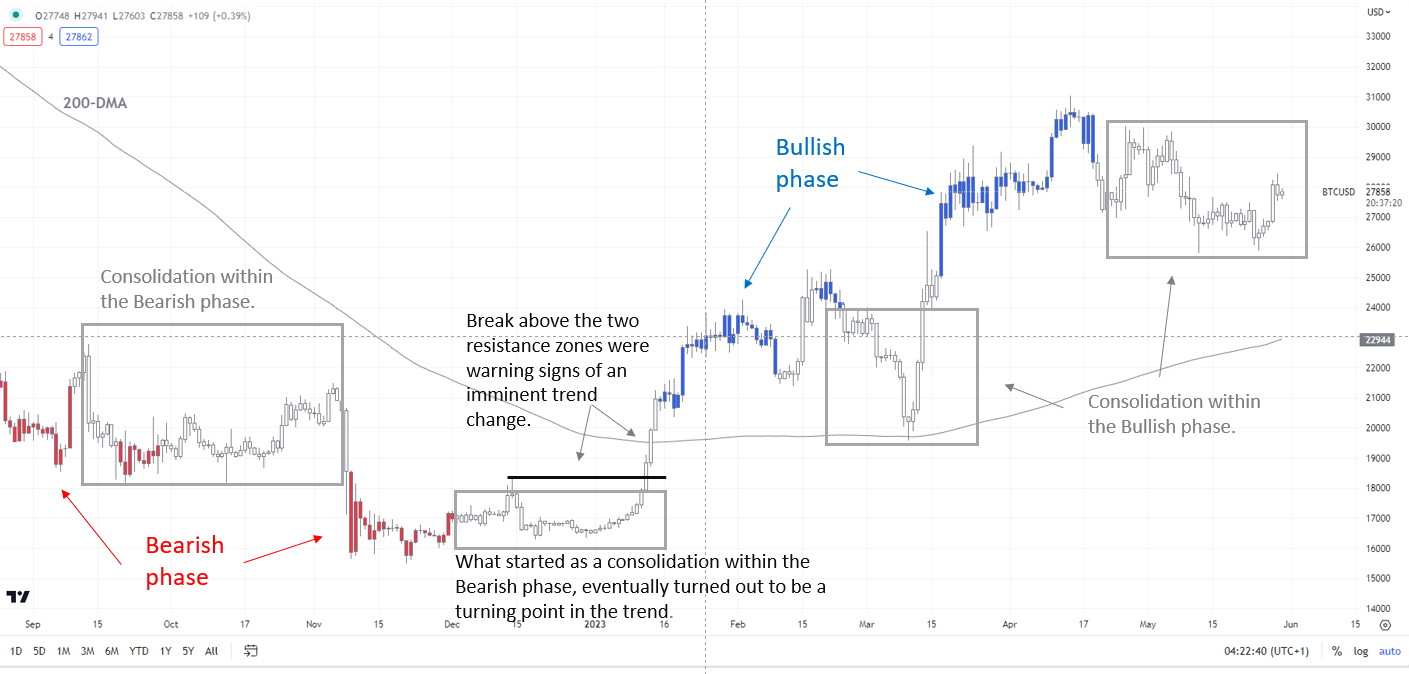
BTC/USD Daily Chart
Chart Created by Manish Jaradi Using TradingView; Refer to notes at the bottom
As highlighted in the previous update, the broader trend in BTC/USD remains bullish, notwithstanding the recent consolidation, as the colour-coded candlestick charts based on trending/momentum indicators show (first highlighted in January – see “Bitcoin Technical Outlook: BTC/USD Turns Bullish“, published January 18). Subsequently, the early May update outlined the prospects of some softness in cryptocurrencies. See “Bitcoin & Ethereum Price Action: Is the Rally Over?” published May 8.
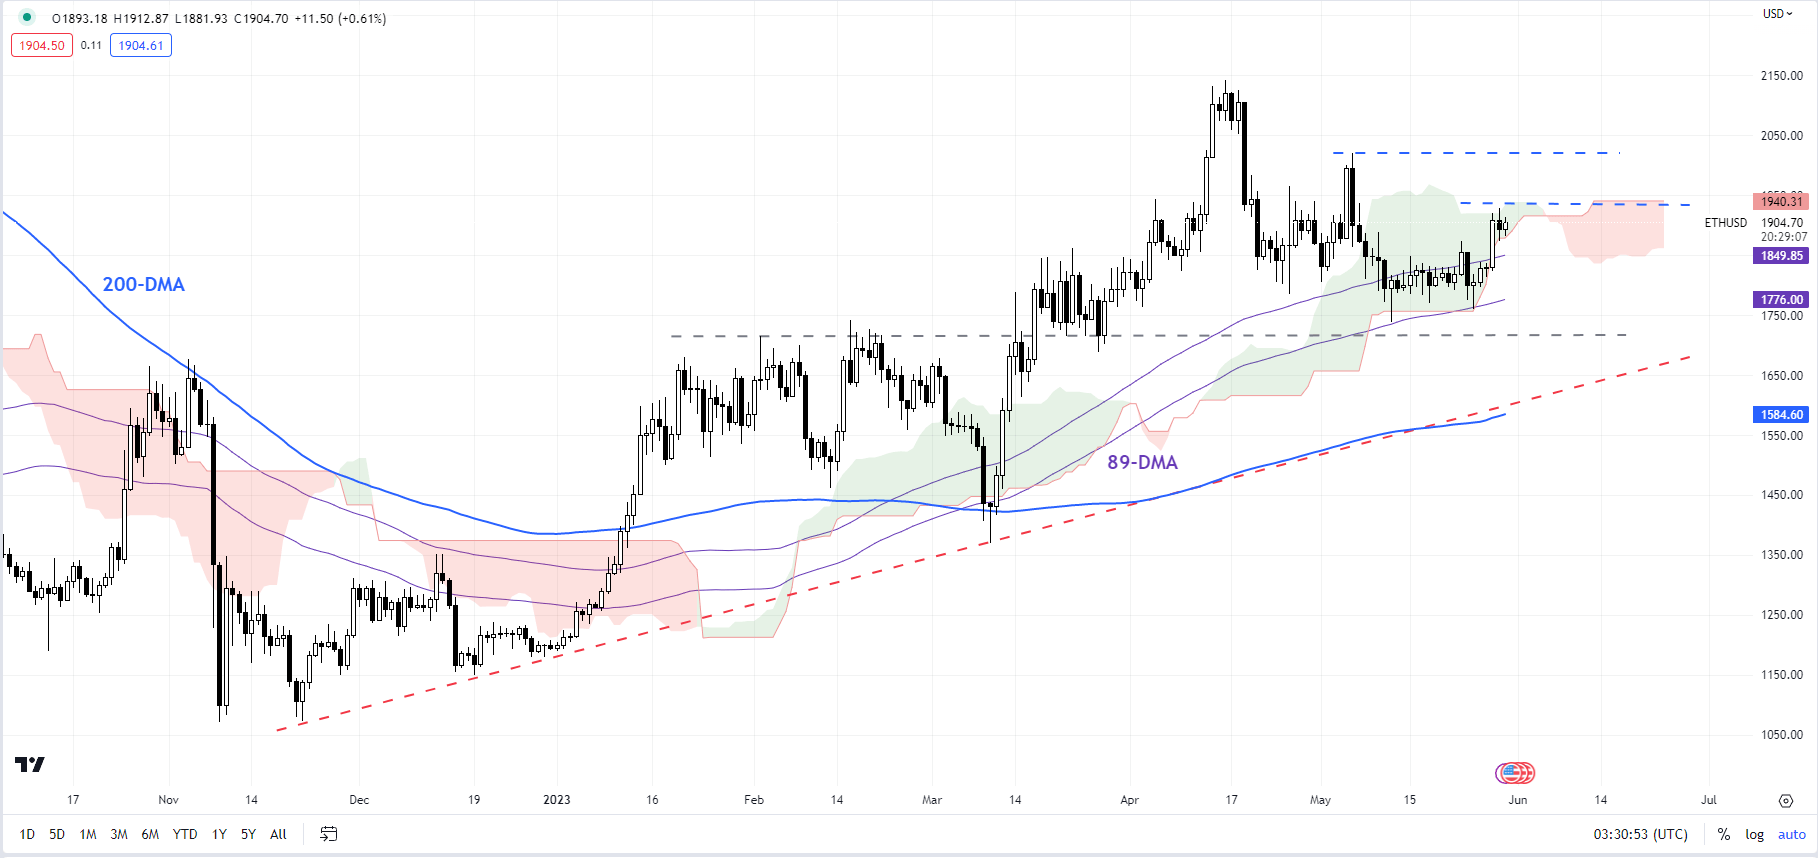
ETH/USD Daily Chart
Chart Created by Manish Jaradi Using TradingView
ETHEREUM: An extended consolidation?
ETH/USD has crossed above the immediate hurdle at last week’s high of 1872, suggesting that the downward pressure has eased a bit. However, ETH/USD needs to break above the May 6 high of 2019 for the downside risks to be eliminated.
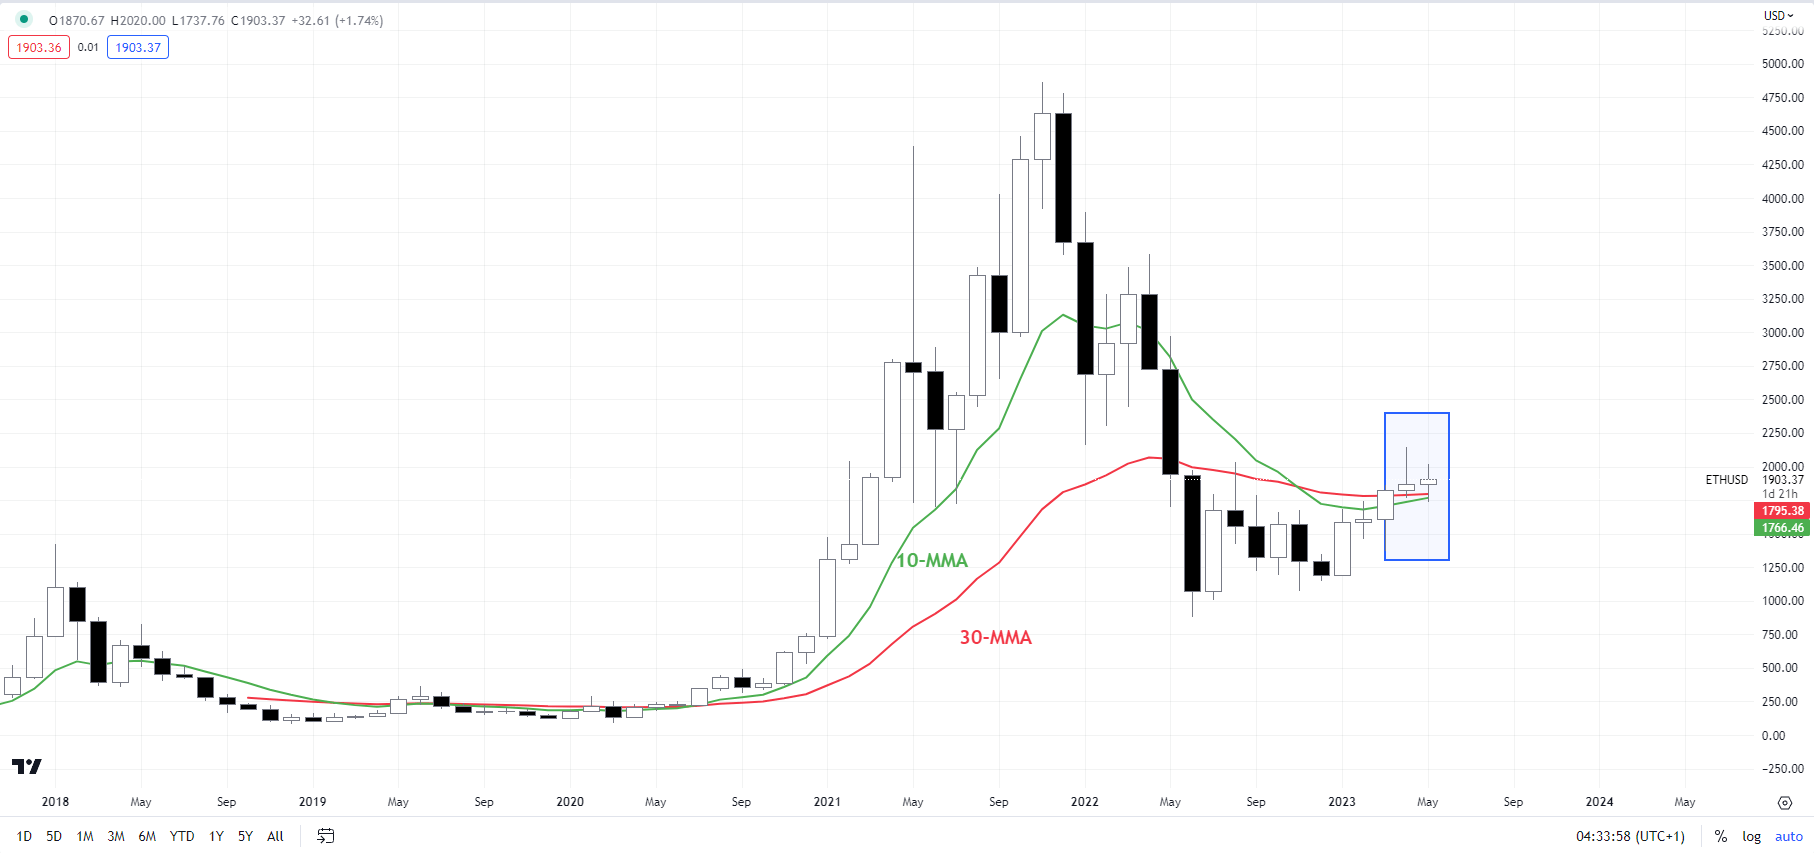
ETH/USD Monthly Chart
Chart Created by Manish Jaradi Using TradingView; Refer to notes at the bottom
ETH/USD has so far held above crucial cushion at the February highs of 1710-1740 (including the 89-day moving average) amid a broader bullish outlook. However, ETH/USD’s fall earlier this month below horizontal trendline support at 1780 could be the start of a broader consolidation/sideway range. Moreover, on the monthly charts, ETH made a lower low this month compared with the April low, suggesting a soft bias.
Note: In the above colour-coded candlestick charts, Blue candles represent a Bullish phase. Red candles represent a Bearish phase. Grey candles serve as Consolidation phases (within a Bullish or a Bearish phase), but sometimes they tend to form at the end of a trend. Note: Candle colors are not predictive – they merely state what the current trend is. Indeed, the candle color can change in the next bar. False patterns can occur around the 200-period moving average, or around a support/resistance and/or in sideways/choppy market. The author does not guarantee the accuracy of the information. Past performance is not indicative of future performance. Users of the information do so at their own risk.
— Written by Manish Jaradi, Strategist for DailyFX.com
— Contact and follow Jaradi on Twitter: @JaradiManish
DailyFX provides forex news and technical analysis on the trends that influence the global currency markets.


