
- Bitcoin price had a breakout from a descending broadening wedge pattern on the 4-hour chart.
- The digital asset doesn’t face a lot of resistance ahead but must defend key support level.
- The number of BTC inside exchanges has plummeted in the last week.
Since April 23, Bitcoin price had a major recovery toward $55,000. The flagship cryptocurrency shifted its momentum in favor of the bulls and aims for a significant 18% upswing.
On the 4-hour chart, Bitcoin had a breakout from a descending broadening wedge pattern on April 27. This breakout has a price target of $64,000 in the long-term. However, Bitcoin needs to hold the previous resistance trend line which acts as support now.
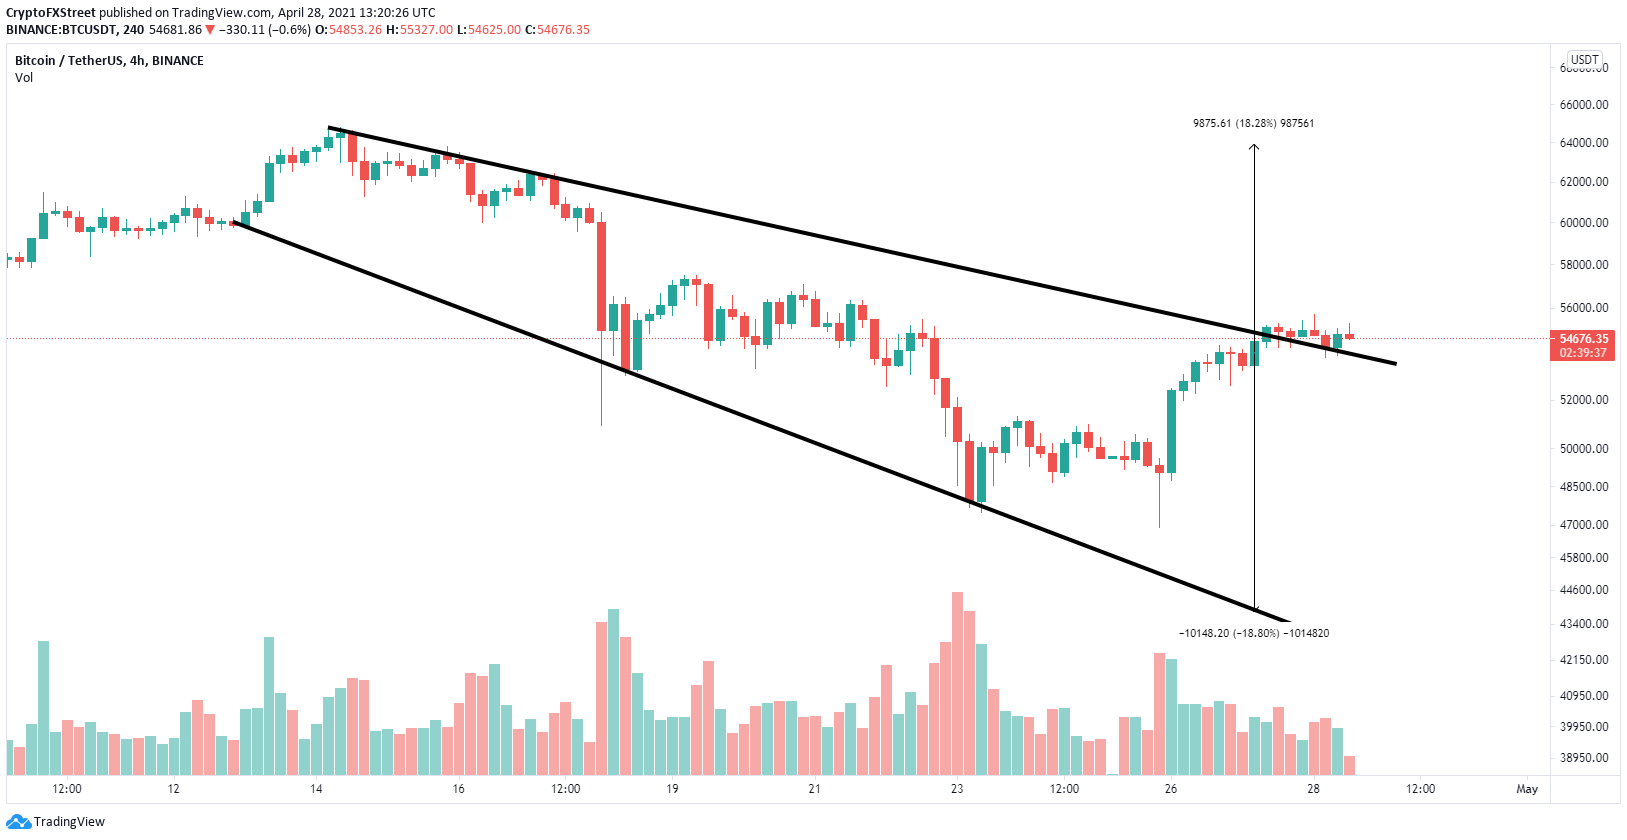
BTC/USD 4-hour chart
One of the most significant on-chain metrics in favor of Bitcoin is the percentage of the total supply of BTC inside exchanges which has fallen by 0.73% in the past month.
%20[17.15.37,%2028%20Apr,%202021]-637552157323084799.png)
BTC Supply on Exchanges
Additionally, the MVRV (30d) ratio which measures the average profit or loss of BTC coins moved in the last 30 days, remains below 0% despite the recent surge. This indicates that most traders in the short-term are not likely to sell.
%20[17.59.10,%2028%20Apr,%202021]-637552157161365075.png)
BTC MVRV (30d) ratio
The only risk for Bitcoin in the short-term is a potential sell signal on the 9-hour chart. The TD Sequential indicator has presented a green ‘8’ candlestick which is usually followed by a sell signal.
If Bitcoin price loses the critical support trend line at $54,000 the digital asset could quickly fall toward $50,000 as there is weak support below this level.