- Cardano price rallies into the convergence of two significant resistance levels.
- Volume sluggish, suggesting a lack of conviction.
- Daily Relative Strength Index (RSI) does not reach an oversold reading.
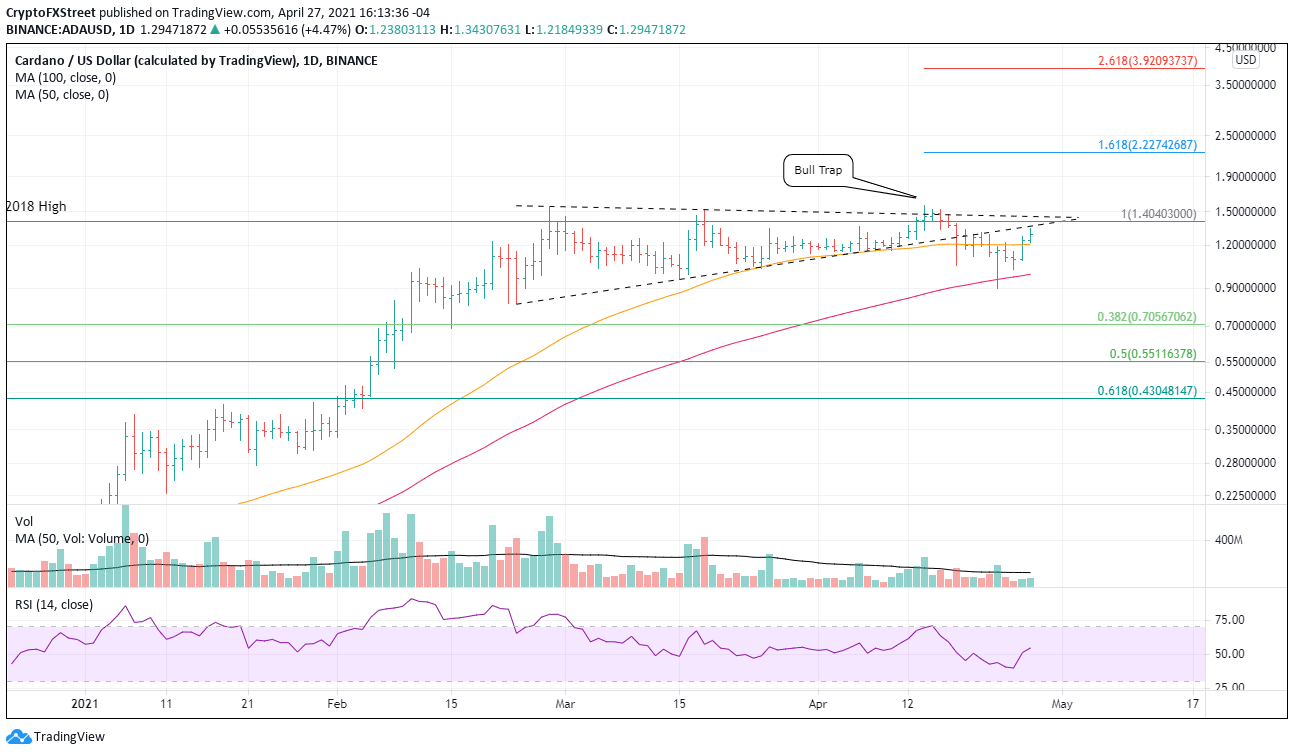
Cardano price has recovered part of the 40% decline, but the combination of the symmetrical triangle’s lower trend line and the 2018 high may ambush the advance. A neutral outlook is an optimal approach with ADA until it springs into new highs.
On April 14, ADA spoofed bullish speculators with a bull trap. A breakout above the triangle’s upper trend line was quickly sold, pushing the cryptocurrency back into the pattern. A few days later, it slashed below the lower trend line and went on to decline close to 30% while overwhelming the 10-week simple moving average (SMA) and finally discovering support at the 100-day SMA.
On a daily timeframe, as seen in the chart below, it is evident that ADA requires a catalyst to shake loose of the determined resistance around $1.40. In the meantime, the outlook prescribes some patience for speculators looking to enter a new trade. There is absolutely no reason to go long at these levels. Instead, wait for a daily close above the April high at $1.57.
A successful breakout can look forward to a test of the 161.8% Fibonacci extension of the April decline at $2.23 and, potentially, a meeting with the 261.8% extension at 3.92.
ADA/USD daily chart
Now, if the lack of commitment, demonstrated by the low volume supporting the two-day rally, portends the future, market operators should be wary of a resumption of the decline. There will be some support at the 50-day SMA at $1.21, but they should give more attention to the 100-day SMA at $0.99. A close below the April low of $0.89 opens another kettle of fish that could evolve into a decline to the 38.2% retracement of the 2021 advance


