-637336005550289133_16x9.jpg)
- Chainlink price has rallied 27% from the June 12 low but remains locked below the 200-day simple moving average (SMA).
- May’s declining trend line will be instructive for any LINK breakouts.
- IntoTheBlock IOMAP metric highlights excessive resistance just below the 200-day SMA.
Chainlink price has renewed its correlation with Bitcoin with a resounding 27% bounce, but volume has languished below the 50-day average, and it is nearing a fundamental resistance level. As long as LINK remains positioned below the 200-day SMA, the trading bias should be neutral to negative.
Chainlink price registered a 70% correction from the May 10 high of $52.99 to the May 23 low of $15.00. Moreover, the May 23 low bottomed 30% below the May 19 low, marking one of the biggest panic sell-offs in the cryptocurrency complex on May 23.
LINK matched the remarkable decline with a 130% rebound into the May 27 high of $35.36, but Chainlink price immediately reverted to the downside, dropping 40% from the May 27 high until reaching the June 12 low $20.02.
The predominant technical influence throughout the LINK volatility has been May’s declining trend line beginning on May 10. It presented resistance just before the historic May 19 crash and reemerged again on June 3-4. Currently, the tactically important trend line crosses the 200-day SMA at $26.45, declaring a new obstacle for the emerging rally attempt.
A daily close above $26.45 would be a positive development for Chainlink price, but it would not guarantee that the corrective process is complete. To secure further confidence, LINK investors should target a weekly close above the strategically important moving average.
Even if the bullish weekly close does materialize, Chainlink price will likely be confronted with more volatility to release the price compression accumulated during the sharp declines and advances since May 19. Thus, patience is merited with one of the leaders in crypto oracles.
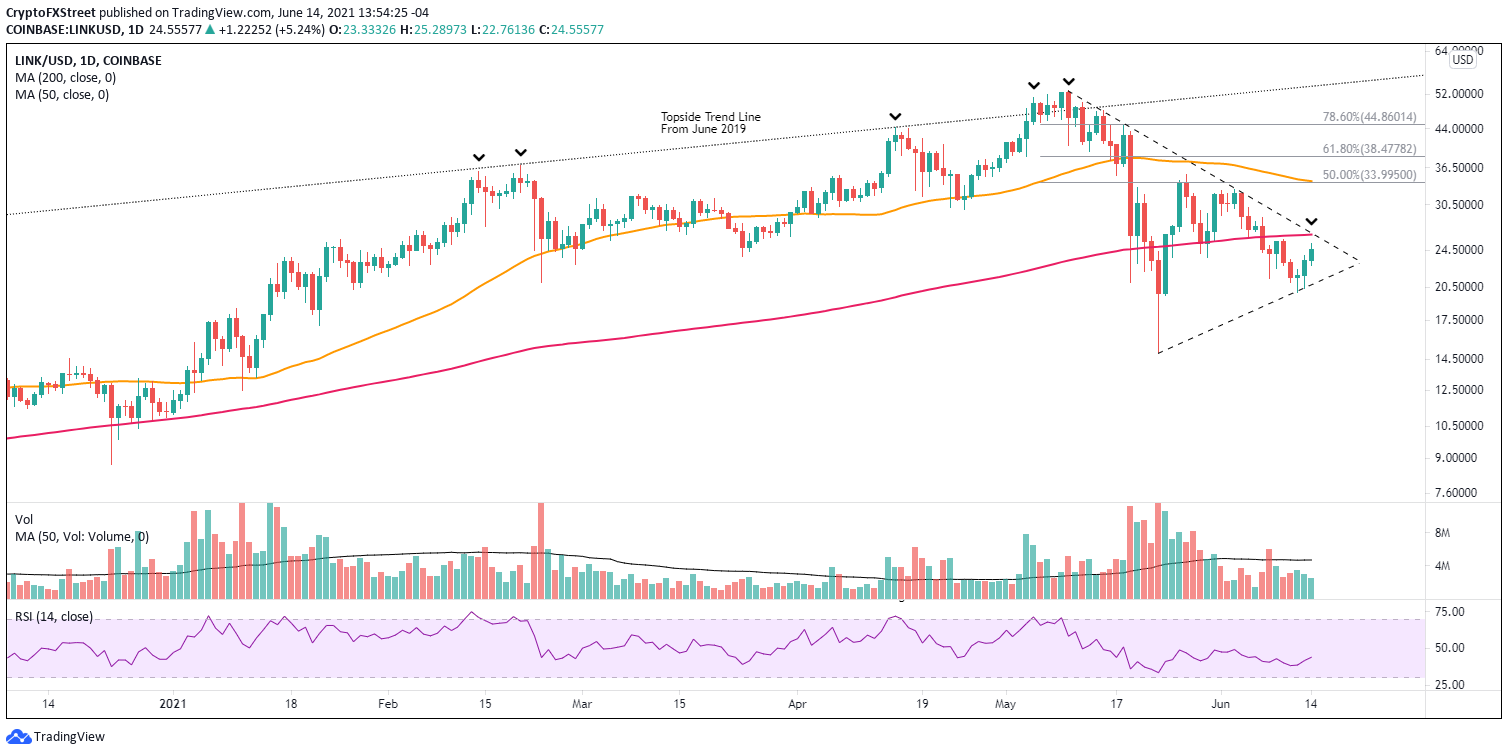
LINK/USD daily chart
If the novelty of the somewhat bullish Elon Musk tweet wears off, Chainlink price may be destined to return to the larger decline, pressing it down to the rising trend line from the May 23 low at $20.90. A daily close below the trend line would offer bears a chance to sweep the May 23 low of $15.00.
The IntoTheBlock In/Out of the Money Around Price metric discloses a notable resistance cluster just below the 200-day SMA. The opposition (out of the money addresses) is within a price range of $25.29-$26.02, containing 11.15k addresses holding 25.04 million LINK.
The metric suggests that Chainlink price faces an unquestioned headwind in its rally attempt to the pivotal moving average and trend line.
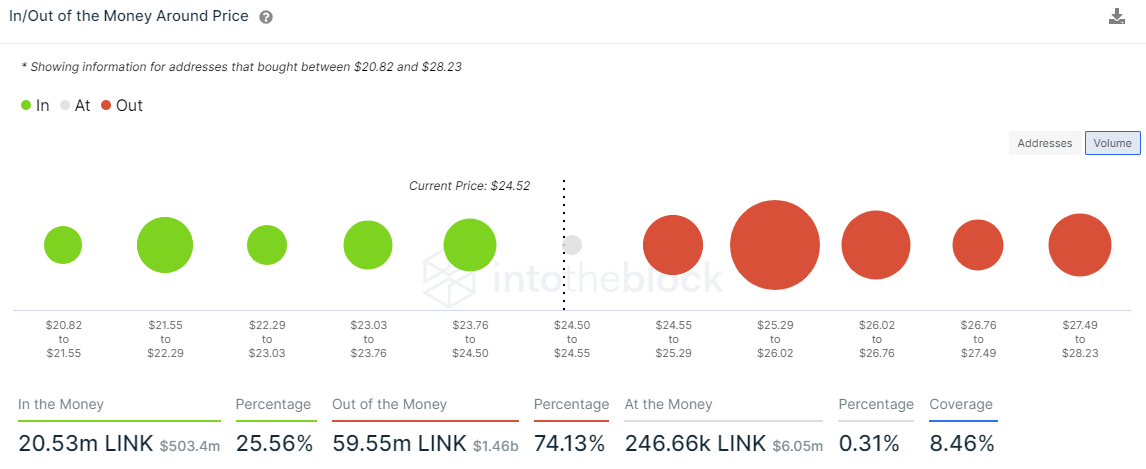
LINK IOMAP – IntoTheBlock
In contrast to the resistance, there is little support (in the money addresses) underpinning Chainlink price down to the rising trend line from May 23.
Chainlink is the 14th largest cryptocurrency by market capitalization, but it is not widely discussed. For that reason, LINK can be portrayed as a follower, not a leader. It tends to be swayed by the governing dynamics of the cryptocurrency market, or recently, by the fortunes of Bitcoin. Imparting too much importance to the digital asset as it lies below the 200-day SMA may be a tactical mistake, at least in the short term.