
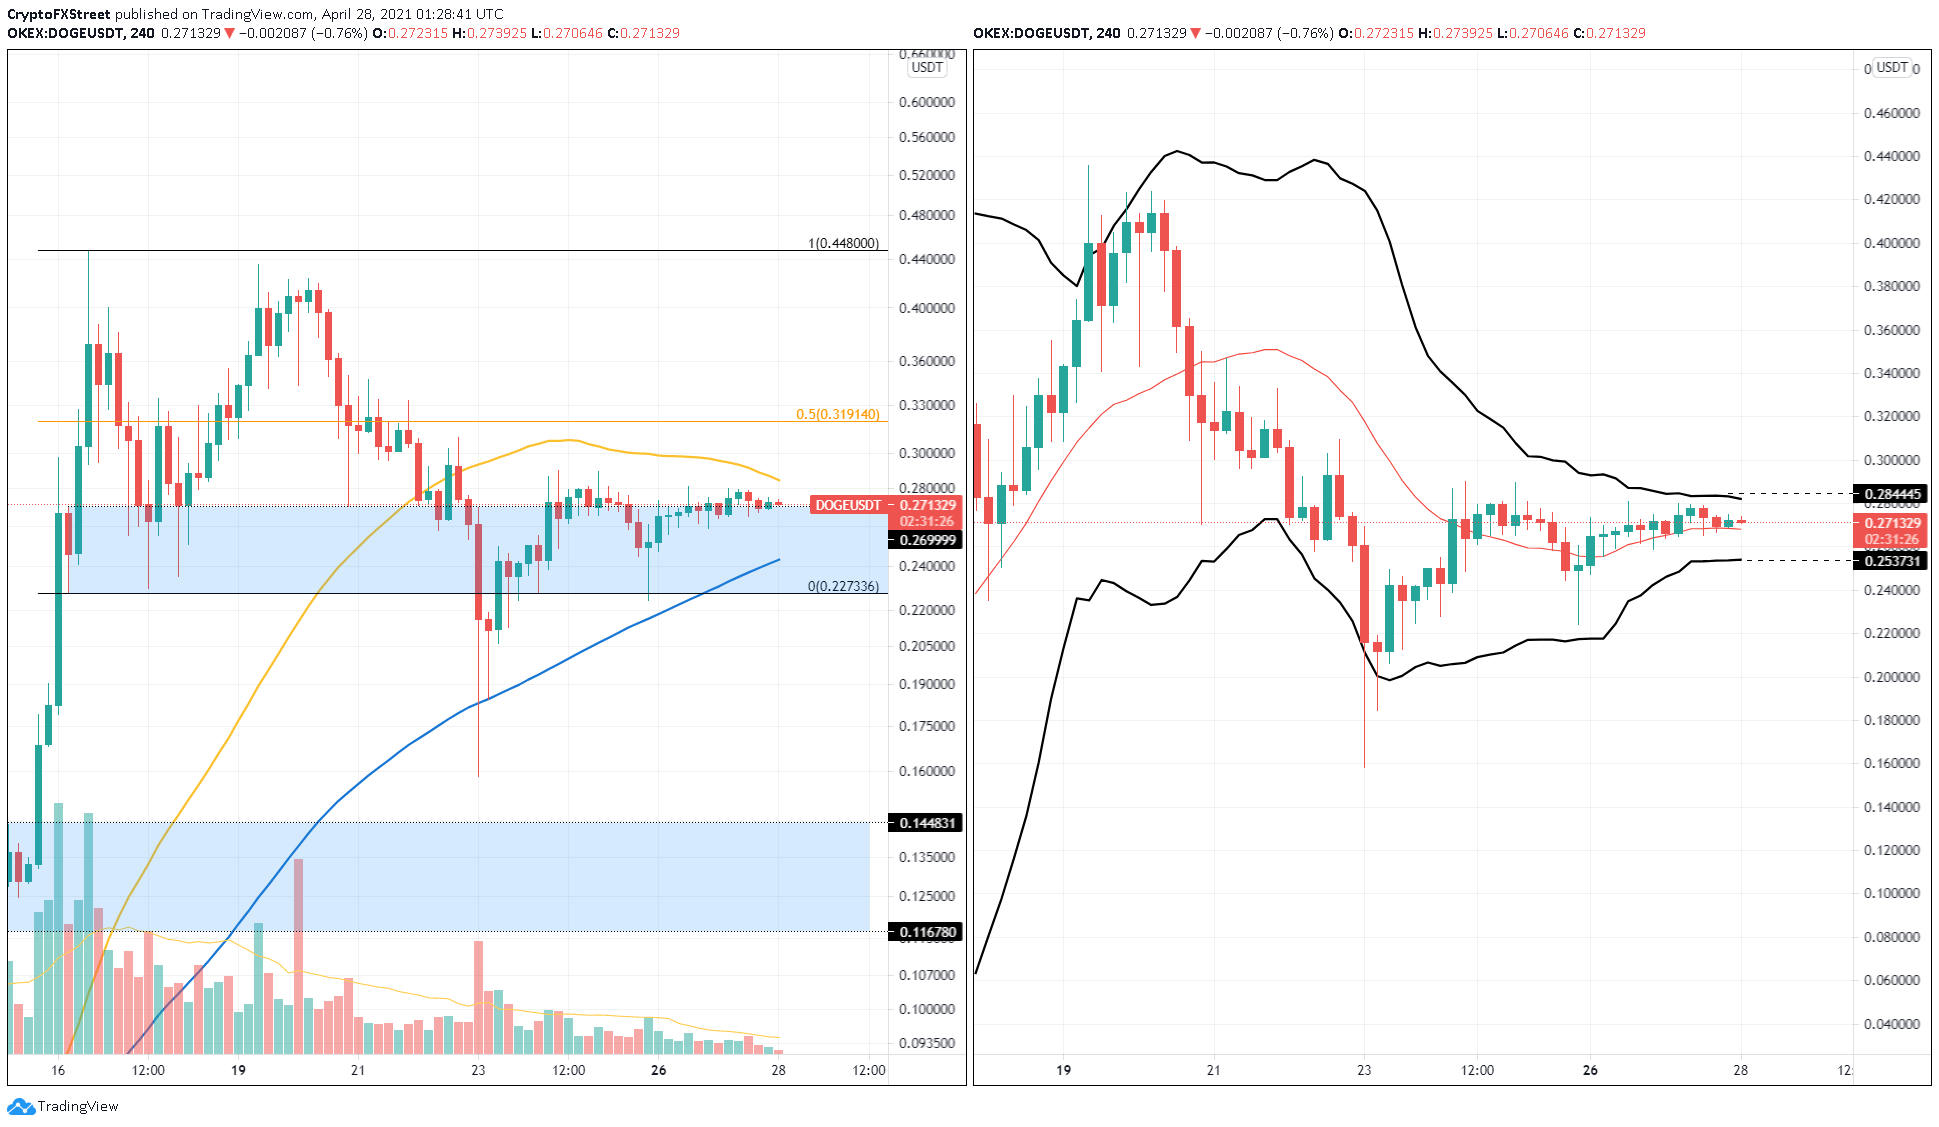
- Dogecoin price has broken out of an immediate supply zone but lacks momentum to stay above it.
- The Bollinger Bands have tightly wrapped DOGE, creating a no-trade zone ranging from $0.284 to $0.253.
- If the demand zone’s lower trend line at $0.227 is breached, a correction could ensue.
Dogecoin price action reveals fleeing investors as hype fades away, at least until they come back in hordes. For now, DOGE is stuck inside a void that lacks volatility, but an upside move out of this zone seems likely.
On the 4-hour chart, Dogecoin price shows a series of candlesticks whose returns are 5% or less for the past three weeks. Such price action shows a lack of investor interest in the meme coin, and the declining volume confirms this.
Dogecoin price moved out of a demand zone’s upper trend line at $0.269, suggesting a bullish bias. However, it is still contained between the 50 and 100 Simple Moving Averages (SMA) at $0.284 and $0.244, respectively.
The Bollinger Bands indicator has tightly enveloped Dogecoin price, suggesting a departure in volatility. A move out of the upper band at $0.284, coinciding with 50 SMA, could signal an upswing’s start and reentry of volatility.
In such a case, market participants could expect DOGE to surge 12% to $0.319, the 50% Fibonacci retracement level. If the buyers pile up, another 40% ascent to $0.448 is possible.
DOGE/USDT 4-hour chart
However, if the buyers fail to step up, leading to a breakdown of the 100 SMA at $0.244, Dogecoin price will likely revisit the support barrier’s lower band at $0.227. If DOGE trades below this level for an extended period, the bullish scenario will face invalidation.
Additionally, such a move would trigger a 10% drop to $0.206.