
Nasdaq 100, DAX 30, FTSE 100 Forecasts: Bearish
- The Dow Jones has broken a major area of support and may suffer deeper declines
- The DAX 30 suffered a disastrous wedge break
- The FTSE 100 also fell out of a rising wedge and could look to continue lower in the days ahead
Dow Jones Technical Forecast
Outlook: Bearish
The Dow Jones suffered notable losses last week following the June FOMC meeting. While the fundamental landscape remains uncertain, the technical landscape of the Dow Jones has undeniably degraded after an area of considerable support was broken. The zone in question was derived from a series of trendlines from the index’s pandemic low and June 2020 swing-high.
Dow Jones Price Chart: Daily Time Frame (September 2020 – May 2021)
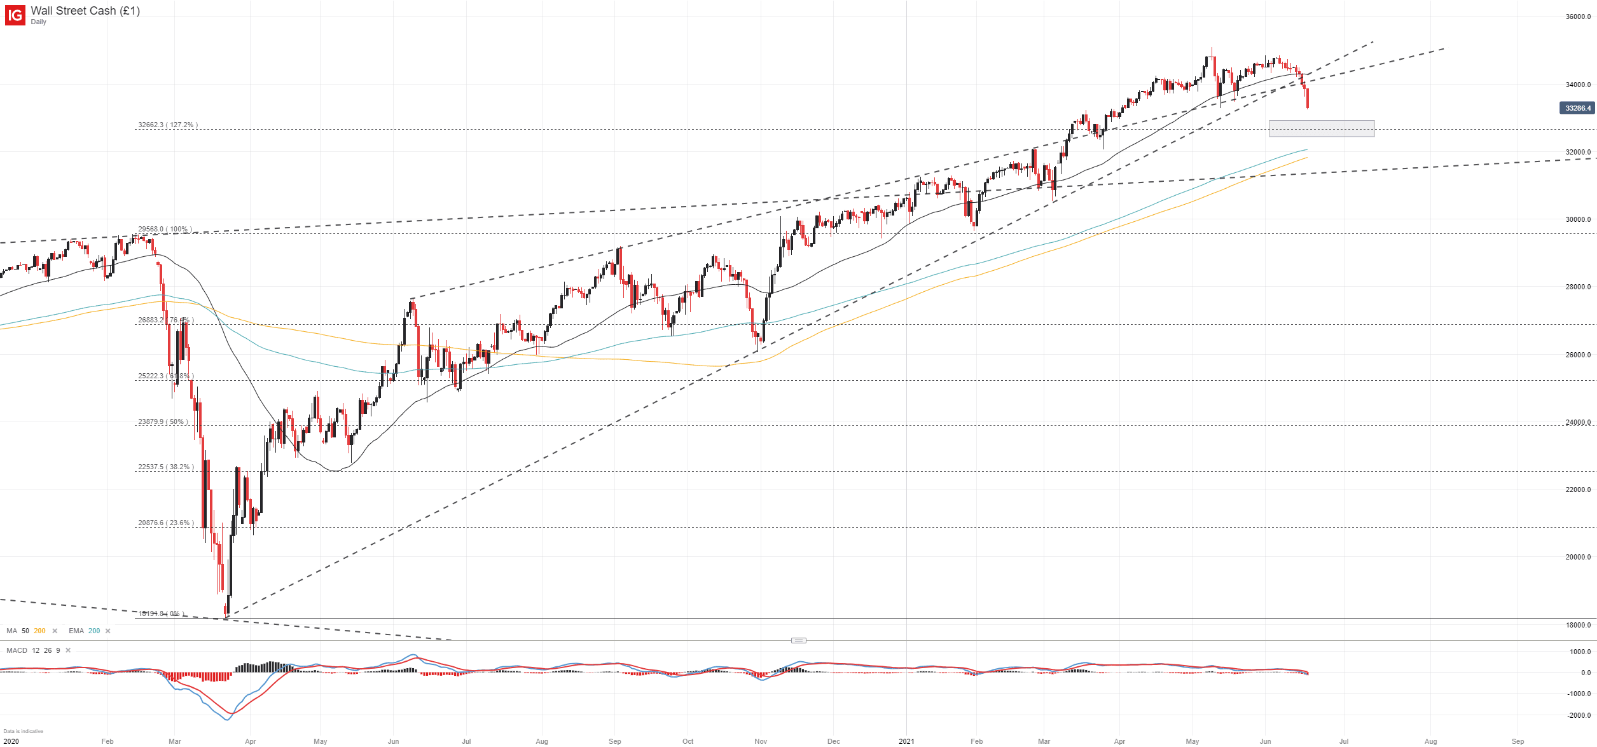
While the Nasdaq 100 and S&P 500 had previously broken beneath their respective trendlines, the Dow enjoyed a supplementary level of support derived from various market peaks throughout the last fifteen months. Until Wednesday the March trendline was unbroken since its inception, making the recent breakdown a severe technical blow. With a major area of support dispelled, subsequent assistance for bulls might not arrive until the Fibonacci level around 32,700 followed by the 200-day moving average near 32,000.
The Trend is Your Friend: Forex Trendlines
DAX 30 Technical Forecast
Outlook: Bearish
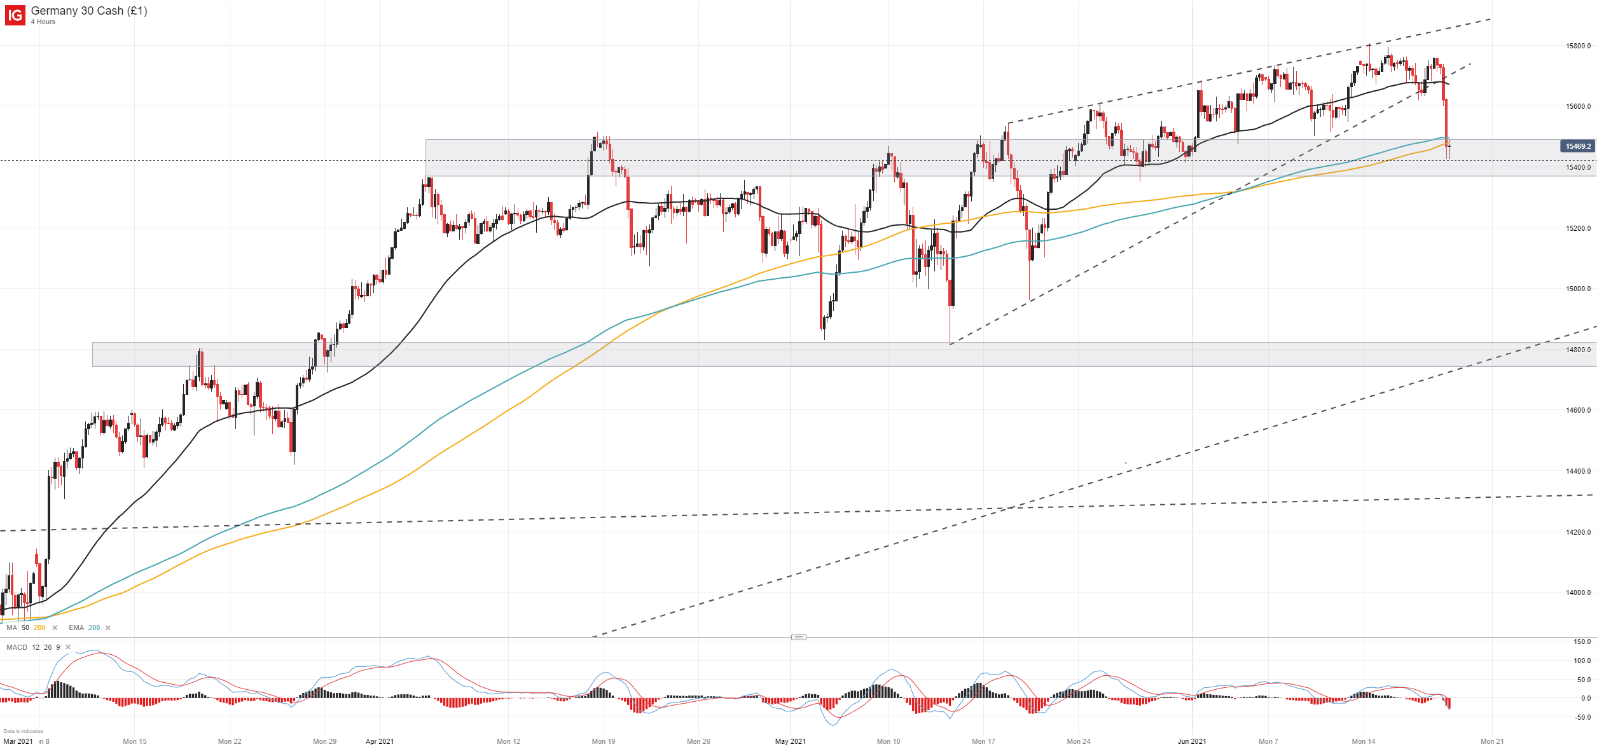
The DAX 30 suffered a wedge break last week and cratered to secondary support along a Fibonacci level at 15,450. The zone will offer bulls an opportunity to try and stave off further declines, but losses could continue should broader risk aversion persist. Either way, the textbook resolution of the rising wedge is a victory for technical traders that had identified the pattern on their charts. In the week ahead, a break through secondary support could see losses accelerate further.
DAX 30 Price Chart: 4 – Hour Time Frame (March 2021 – June 2021)
FTSE 100Technical Forecast
Outlook: Bearish
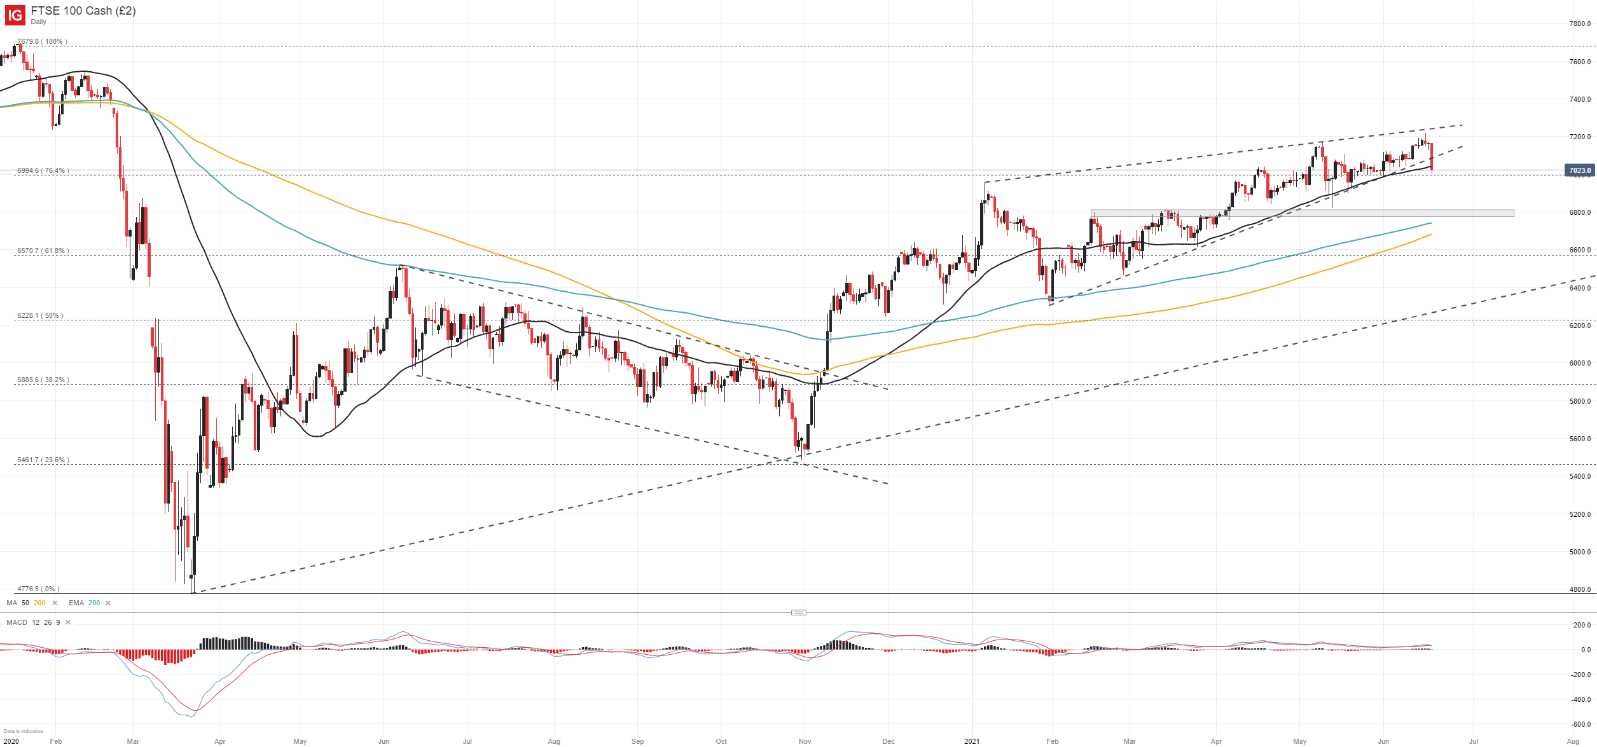
In my last FTSE 100 update we noted the wedge-break potential evident on the price chart. As fate would have it, the index has since broken lower amid a burst of risk aversion and with the rising wedge pattern resolved, the index could look to fall further and seek support around 6,800. While the technical outlook has undoubtedly worsened, the 50-day simple moving average may look to halt an attempted continuation lower.
FTSE 100 Price Chart: Daily Time Frame (January 2020 – May 2021)
Across the board then, it would seem the major indices have suffered some key technical breaks that may open the door to further losses. While the technical landscapes have worsened, seasonality remains a concern and if volatility and volume dry up, a continuation lower may be difficult to establish despite the weakened charts. In the meantime, follow @PeterHanksFXon Twitter for updates and analysis.
–Written by Peter Hanks, Strategist for DailyFX.com