U.S. Indices Technical Highlights:
- Nasdaq 100 could carve out a macro-sized wedge
- Dow Jones lower-low may only be beginning of bull-flag
Dow Jones & Nasdaq 100 Technical Outlook Continues to Diverge
This year has brought with it a very interesting series of rotations between old-school and new-school stocks, which has the Dow and Nasdaq 100 trading places on a regular basis. This theme doesn’t look likely to end any time soon, so we will need to continue looking at these two major indices through their own technical lens’.
The Nasdaq 100 has taken back leadership from the Dow, which has led it to record territory again. The trend at the moment is strong and hard to fight, but there is the possibility of weakness here that could fill out a pattern that has been in the works since February.
If the NDX pulls back it could complete a nicely formed wedge pattern that will then at some point likely this summer lead to a big move. The trend is up and as such it would seem such a breakout would come on the top-side, but we wouldn’t be able to rule out the possibility that it turns into a topping formation.
For now, again we will want to respect strength. In the event of a decline from here, watch the underside of the wedge pattern (also the September trend-line) for support, currently just above 13400.
Nasdaq 100 Daily Chart (wedge possibility)
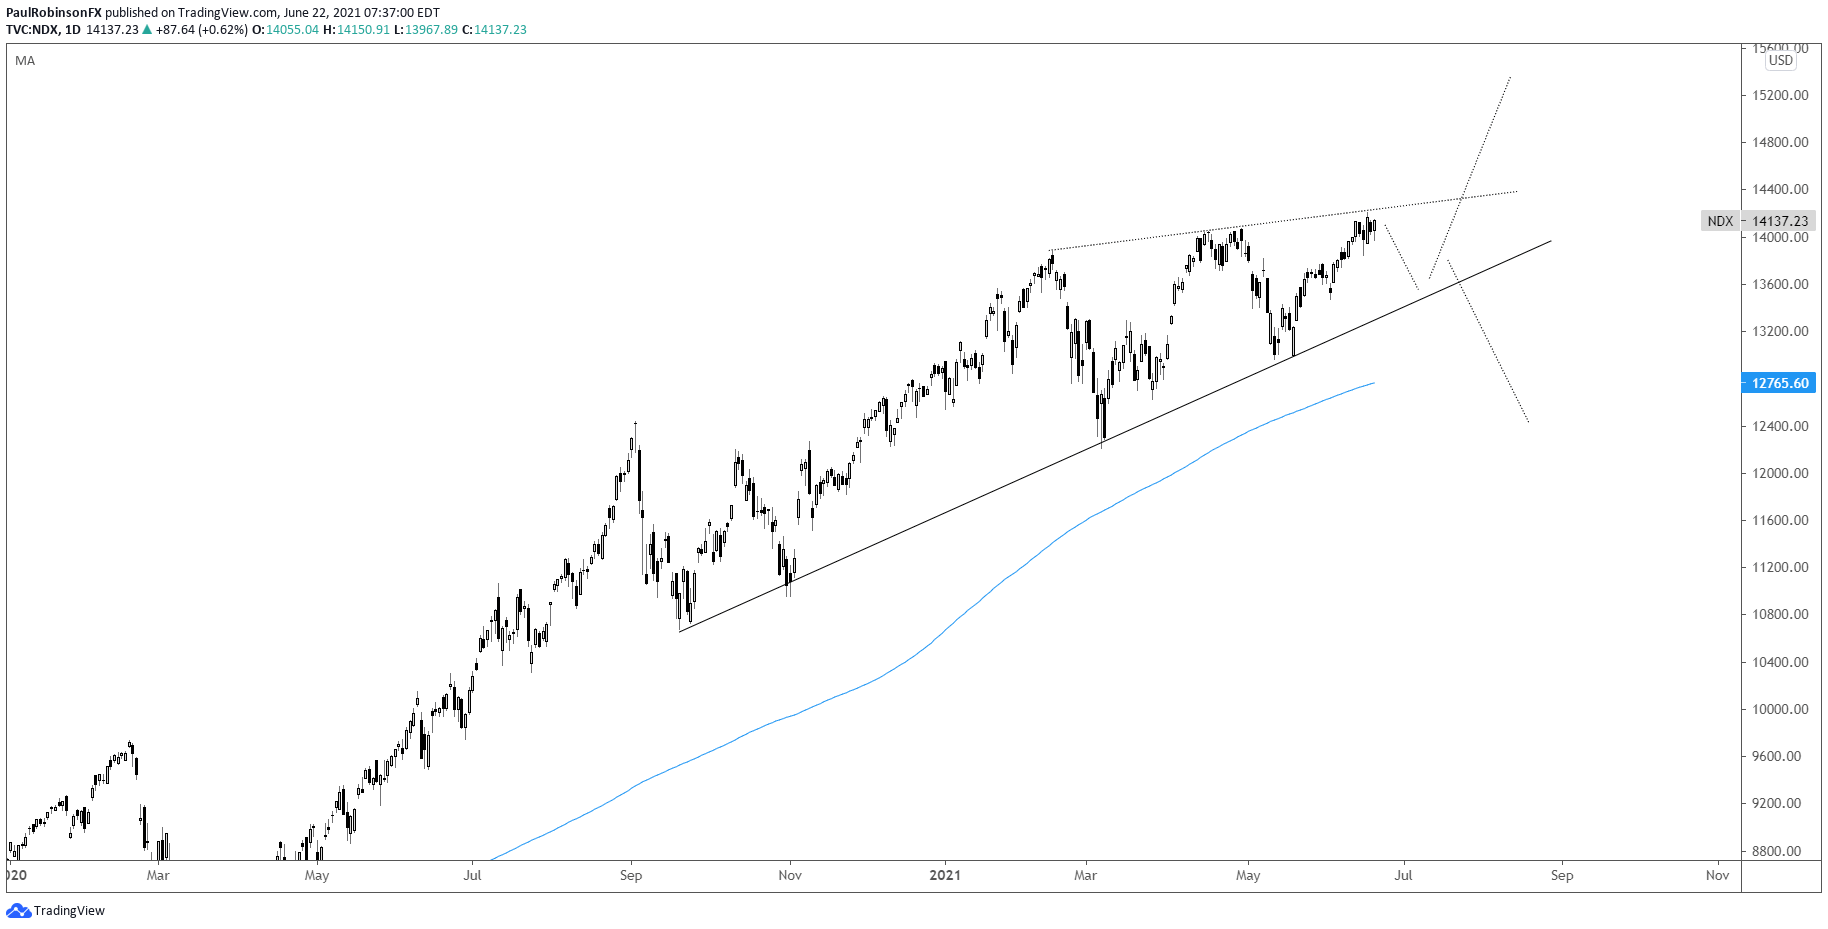
Nasdaq 100 Chart by TradingView
The Dow Jones just rolled over and carved out a lower-low from May, the first intermediate-term lower-low since late October. That turned out not to be a sign of more weakness ahead, but instead a low that led to a rally into the U.S. elections and beyond.
A similar scenario could play out here where this is the end of a correction. If it takes some time to back-and-fill, it may even fill out a bull-flag pattern. The March trend-line and June slope were both broken, so there is still some concern of lower prices, and on that it may be best to wait for further developments before dialing up a bullish bias.
But if this pattern does come to develop and the Dow strengthens, then look for this to take some power out of the Nasdaq 100 as the rotation swings back in favor of value over growth
Dow Jones Daily Chart
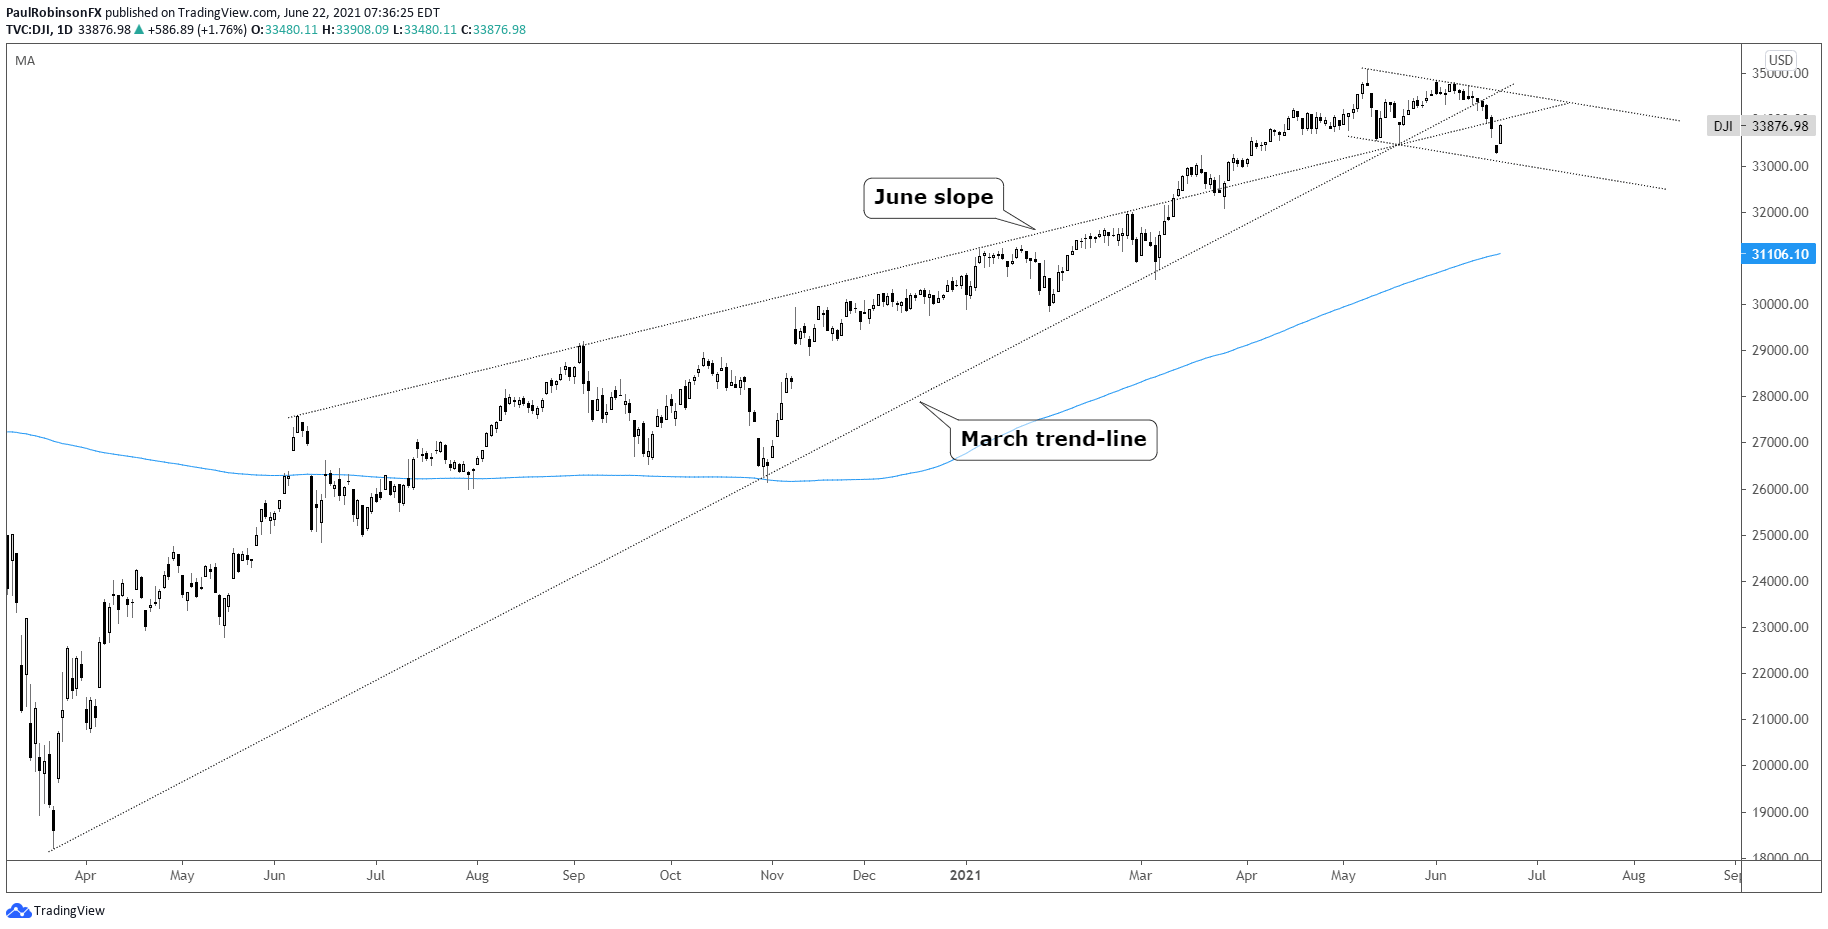
Dow Jones Chart by TradingView
Resources for Forex Traders
Whether you are a new or experienced trader, we have several resources available to help you; indicator for tracking trader sentiment, quarterly trading forecasts, analytical and educational webinars held daily, trading guides to help you improve trading performance, and one specifically for those who are new to forex.
—Written by Paul Robinson, Market Analyst
You can follow Paul on Twitter at @PaulRobinsonFX