
Dow Jones, S&P 500, Technical Analysis, Retail Trader Positioning – Talking Points
- Stocks on Wall Street remain vulnerable after last week’s wobbly performance
- Rising retail trader long bets in the Dow Jones and S&P 500 offer warning sign
- Bearish candlestick patterns in them are still in play, will key trendlines hold?
Last week, IG Client Sentiment (IGCS) hinted that the Dow Jones and S&P 500 were at risk of turning lower. IGCS is a tool to gauge retail trader positioning and it is often used as a contrarian indicator. Investors were starting to unwind deeply skewed net-short positioning in the Dow and S&P. This could have been due to forced liquidation as prices climbed over the past few months, resulting in most retail traders realizing losses.
Now, the same bearish warning signs in the Dow and S&P persist. From a psychological standpoint, this could be due to retail traders buying recent dips in hopes of a bounce in the stock market. If this dynamic continues, then the indices could decline. Check out last week’s webinar recording, where I discussed the indices and demonstrated how you can use IGCS in your own trading strategy.
Dow Jones Sentiment Outlook – Bearish
The IGCS gauge implies that about 44% of retail traders are net-long the Dow Jones. Upside exposure has increased by 8.34% and 5.41% from yesterday and last week respectively. The fact that traders are net-short hints prices may continue rising. However, recent changes in positioning warn that the Dow Jones may soon reverse lower.

Technical Analysis
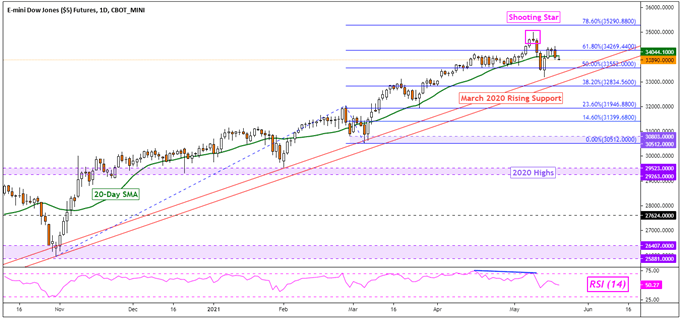
Dow Jones futures extended losses following the emergence of a bearish Shooting Star candlestick pattern. Subsequent downside confirmation opened the door to further losses. Still, the 20-day Simple Moving Average has been holding as key support. This is as rising support from March 2020 is maintaining the dominant upside focus. Extending gains exposes the 78.6% Fibonacci extension at 35290.
Dow Jones Futures Daily Chart
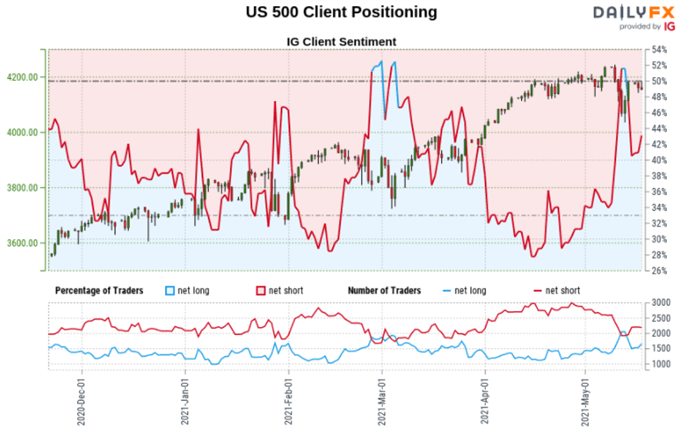
S&P 500 Sentiment Outlook – Bearish
The IGCS gauge implies that about 45% of retail investors are net-long the S&P 500. Upside exposure has increased by 8.44% and 2.60% over a daily and weekly basis respectively. The fact that traders are net-short hints prices may continue rising. But, recent changes in positioning warn that the current price trend may soon reverse lower.
Technical Analysis
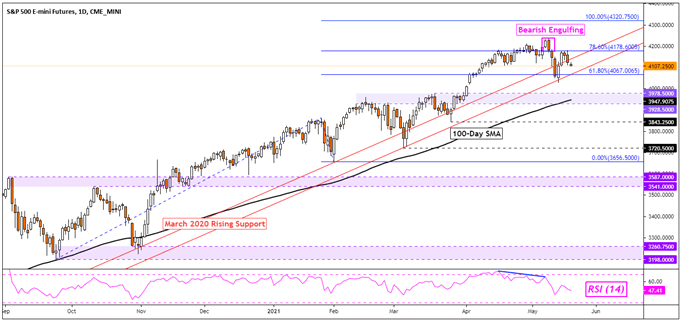
The S&P 500 confirmed losses under a Bearish Engulfing candlestick pattern, opening the door to a downside technical bias in the near-term. Prices are testing key rising support from March 2020 which could maintain the dominant focus to the upside. Otherwise, breaking under would expose the 100-day SMA as key support below. Extending gains entails a push to the 100% Fibonacci extension at 4320.
S&P 500 Futures Daily Chart
*IG Client Sentiment Charts and Positioning Data Used from May 18th Report
— Written by Daniel Dubrovsky, Strategist for DailyFX.com
To contact Daniel, use the comments section below or @ddubrovskyFX on Twitter