
“Tuesday Trade” Journal: One of the most important concepts in trading is to review your work, and learn from the good and the bad. Identifying what is working is critical — to do more of it. So, to lead by example, each Tuesday, you’ll get a trade from my trading journal, in which I explain my thought process from start to finish. Trading is all about finding something that works, and applying it over and over again. That’s how you find trading success. So study up on this “Tuesday Trade” and let’s get to work.
This week, I want to talk about my “run into earnings” trade with Best Buy (NYSE: BBY).
Wave Three Up Next…
The “run into earnings” season consists of three waves. The first one happens at the beginning of the quarter when banks and Facebook (NASDAQ: FB), Amazon (NASDAQ: AMZN), Apple (NASDAQ: AAPL), Netflix (NASDAQ: NFLX), and Alphabet (NASDAQ: GOOGL) (formerly known as Google) (FAANG) report. This initial wave is typically my favorite because there are no preconceived notions or anticipation going into the quarter. The next wave comes directly afterward when a lot of big tech names report. Historically, this is also the most volatile wave of the three, as it is right after the FAANG reports, and the market tends to pull back during this time.
Now, we have entered the third wave of the “run into earnings” trades. This last wave is saved mostly for retail companies to report their earnings, which is why I had my eye on Best Buy.
Entering With A Butterfly…
As with all of my “run into earnings” trades, I like to get into my setup several weeks before the report. So, in consideration of the BBY earnings report releasing on May 27, I entered this trade on April 26 with a target of $125 (BUY +2 BUTTERFLY BBY 100 21 MAY 21 115/125/135 CALL @2.98 limit order). Pictured below is my options chain:

When I entered this trade, the market was chopping sideways, but I was still confident in this setup for two reasons. One, because this was a longer-dated trade, and regardless of volatility that week, I knew I would hold onto it because I had given myself a generous 25 days before expiration. This large window will allow me to ride out much of the volatility until an appropriate time to sell.
The second reason was that my Hot Zone Indicator (pictured below) showed me that BBY had a squeeze, with a high-probability “run into earnings” along with a Fibonacci target right at previous highs.
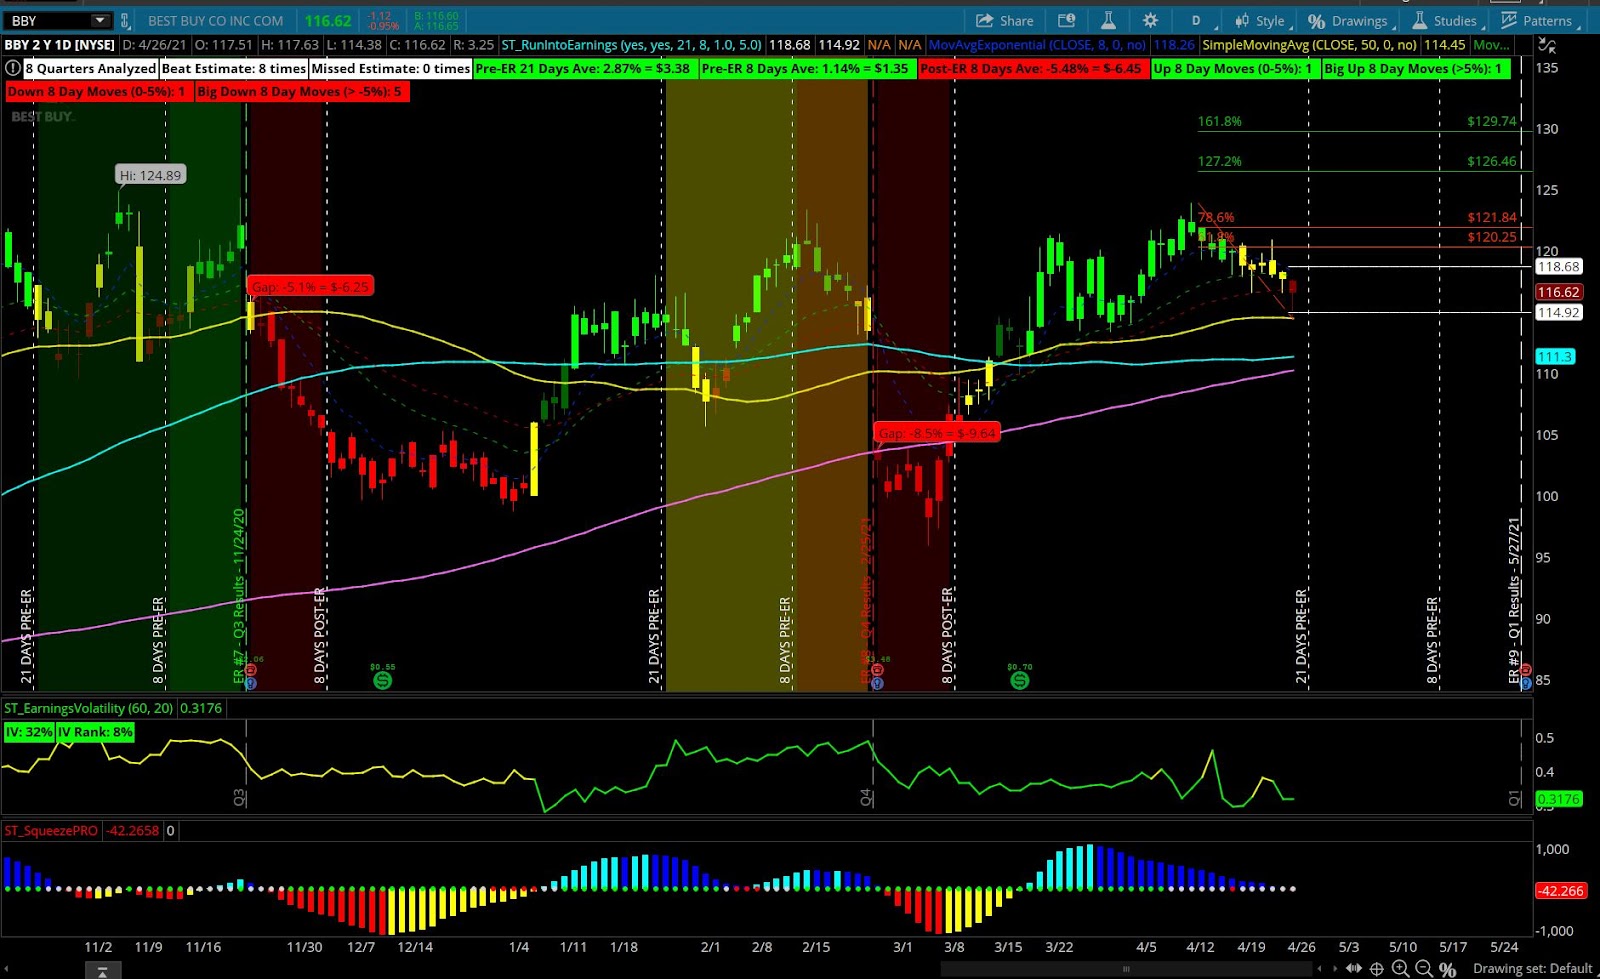
A few days into holding this position BBY hit the 50% retracement zone and was pulling back. Though this was not what I had hoped for, it was still in a squeeze with plenty of time left before expiration. I held strong.
“Sell In May And Go Away”
The common phrase “sell in May and go away” eludes the seasonally weak market conditions that normally start to skulk around near the beginning of May. Because of this notion, despite my large window before expiration, I was still watching closely to see when I could snatch profits on BBY and get out.
Finally, on May 10, I saw my window of opportunity as BBY was meeting my center strike and I quickly closed for profits (SELL -2 BUTTERFLY BBY 100 21 MAY 21 115/125/135 CALL @5.11 limit order). Pictured below is my exit thanks to the Hot Zone Indicator.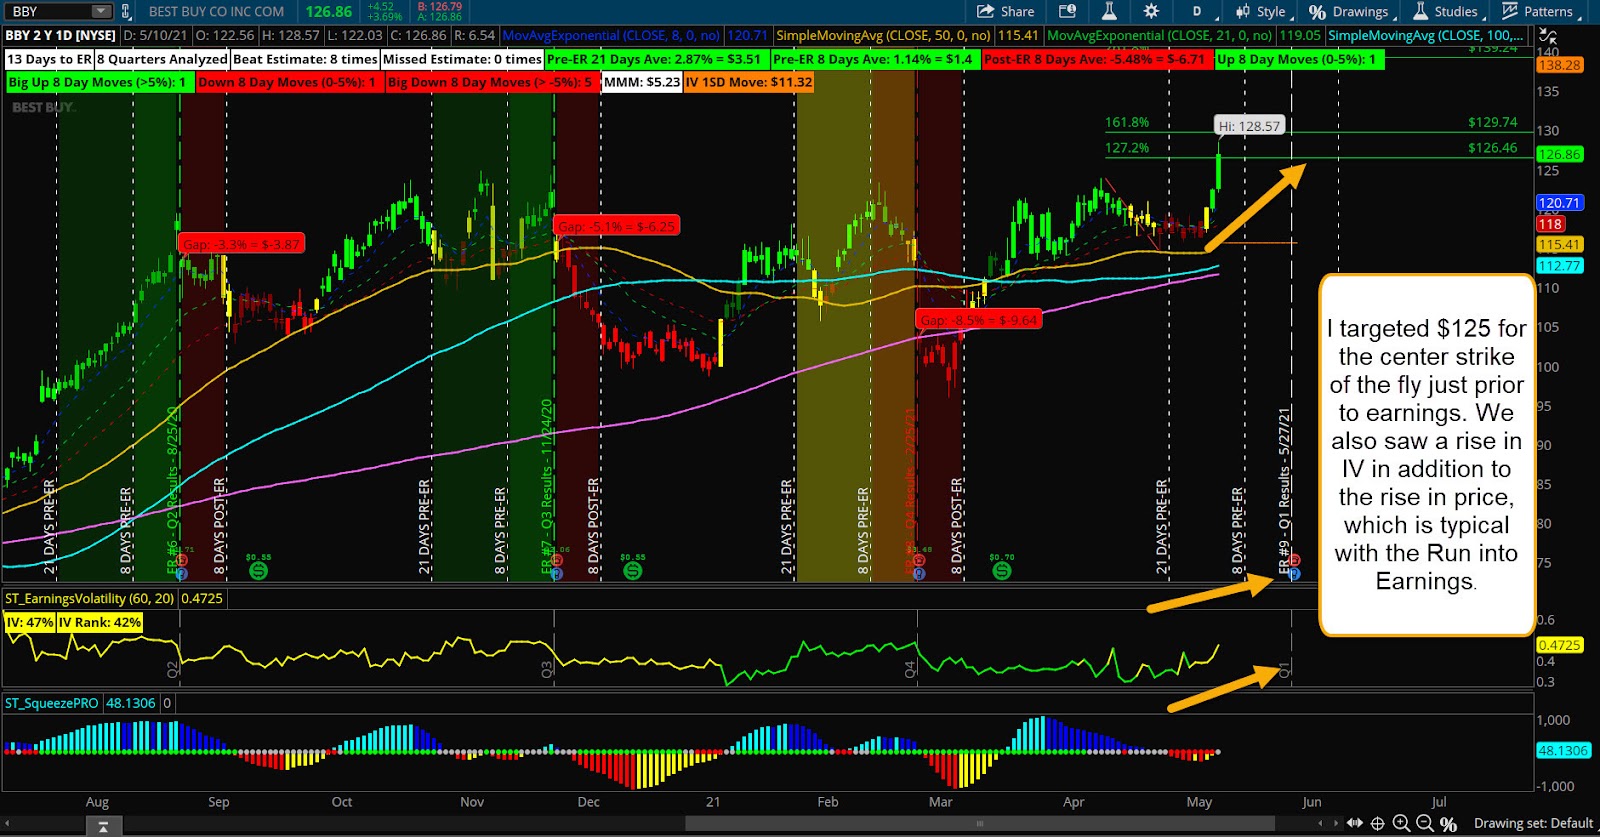
Want your charts to look like Danielle’s? Click here to get her Hot Zone indicator and class, where she teaches you how to capture earnings trades through actionable setups.
Image Sourced from Pixabay