

EUR/USD and EUR/GBP Prices, Charts, and Analysis
EUR/USD holding steady above 1.1200.The Fed blackout period won’t help the US dollar.
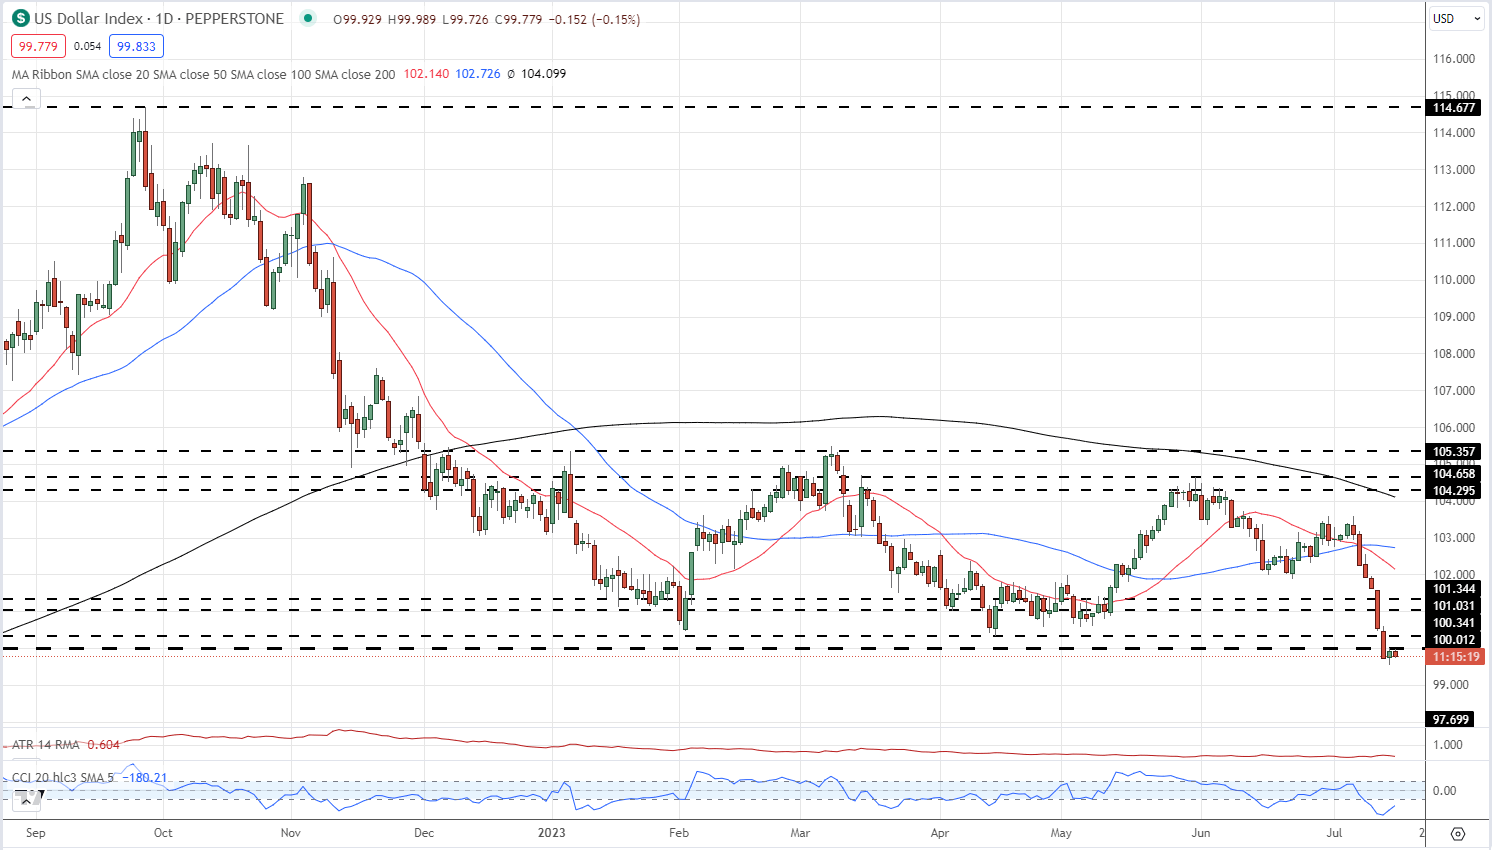
The US dollar opens the week on the back foot with the US dollar Index back below 100 and close to a fresh 15-month low. With little in the way of market-moving US economic data on the docket this week, and with no Fed speak until after the FOMC decision on July 26, the dollar, and dollar pairs, will be driven by external forces ahead of the Fed meeting.
For all market-moving events and economic data releases, see the real-time DailyFX Calendar
US Dollar Index Daily Price Chart
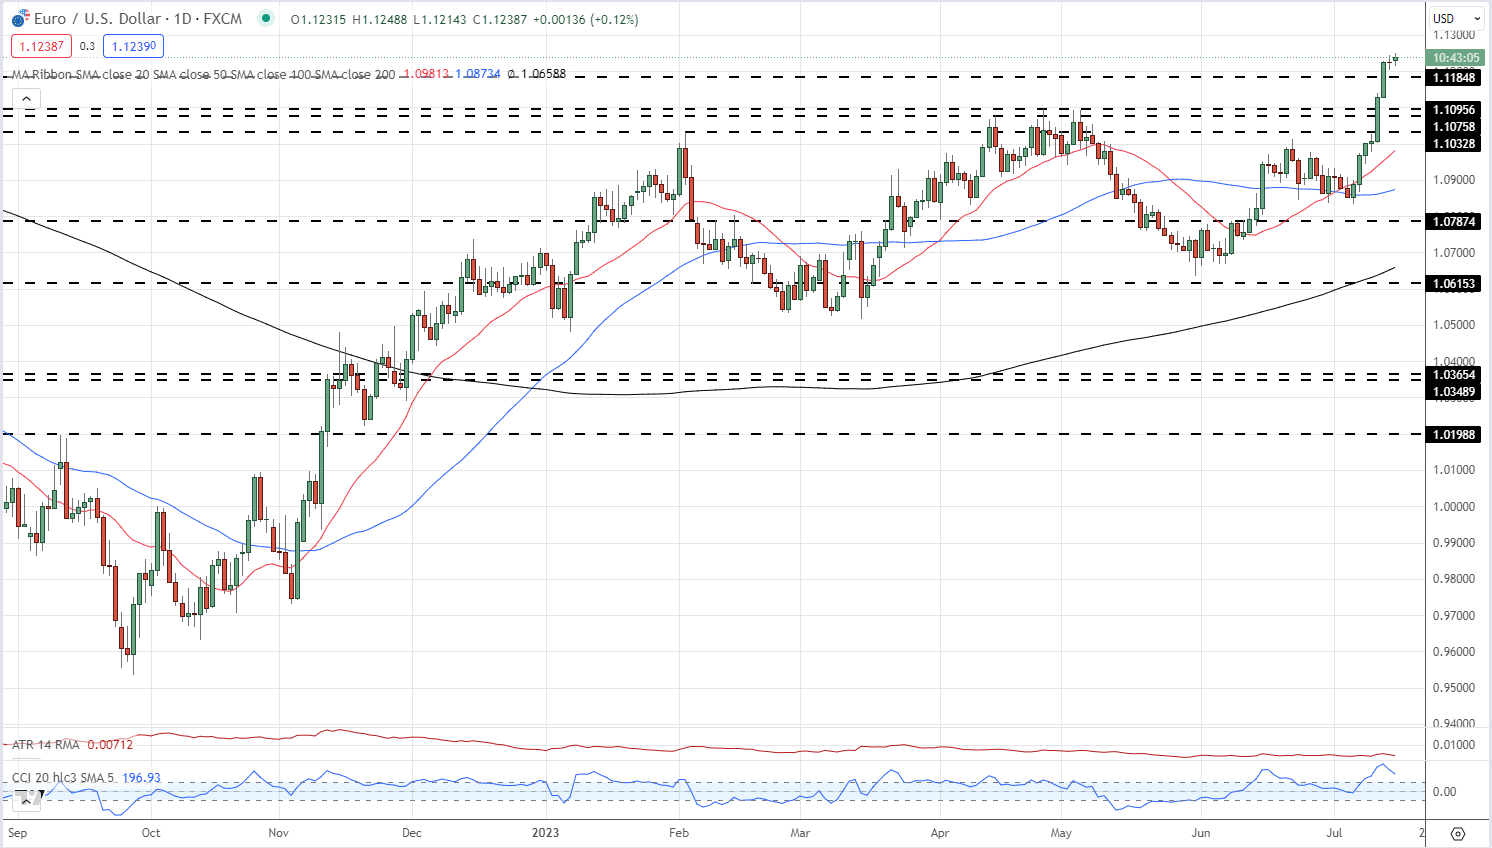
EUR/USD remains firm but current price action is starting to look stretched. The CCI indicator shows EUR/USD in overbought territory, while the pair has rallied by over four big figures in the last 11 days. Last week’s weekly rally was the largest since the start of November last year. Initial support is seen at 1.1185 ahead of 1.1100.
EUR/USD Daily Price Chart – July 17, 2023
Chart via TradingView
Retail Traders are Extremely Short EUR/USD
Retail trader data shows 21.94% of traders are net-long with the ratio of traders short to long at 3.56 to 1.The number of traders net-long is 1.67% higher than yesterday and 33.44% lower than last week, while the number of traders net-short is 1.27% higher than yesterday and 27.38% higher than last week.
We typically take a contrarian view to crowd sentiment, and the fact traders are net-short suggests EUR/USD prices may continue to rise. Positioning is less net-short than yesterday but more net-short from last week. The combination of current sentiment and recent changes gives us a further mixed EUR/USD trading bias.
The Euro is struggling to regain recent losses against the British Pound as interest rate differentials, and expectations, continue to support GBP. The main UK economic release this week, June inflation data on Wednesday at 07:00 UK, will be the next driver of the pair.
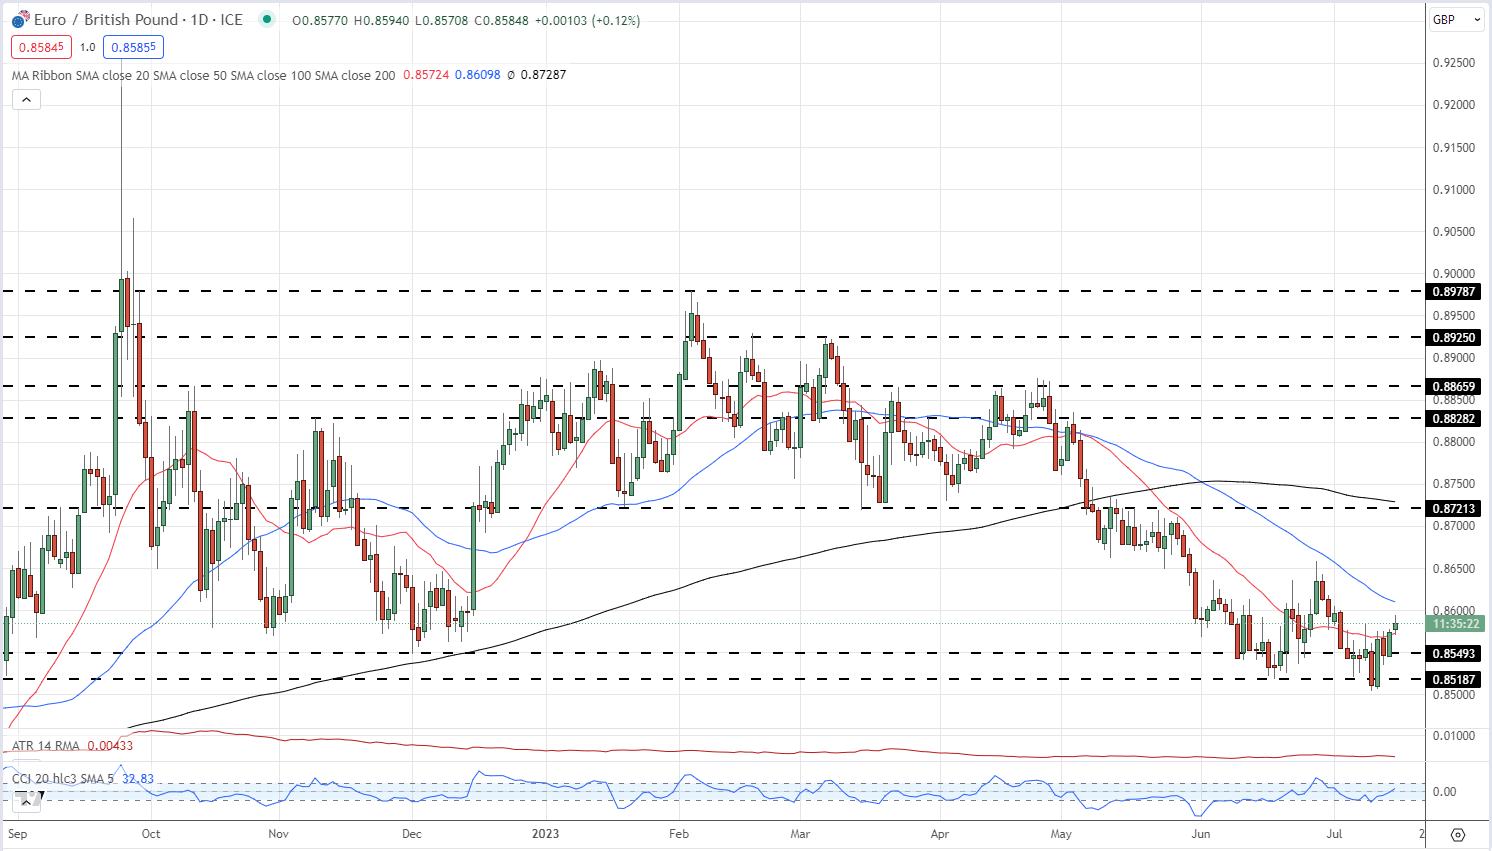
UK inflation remains uncomfortably high for the Bank of England, and if this remains the case then Sterling may strengthen further. On the flip side, if UK price pressures fall by more than expected, then Sterling will move lower. EUR/GBP is not as stretched as EUR/USD with retail traders currently long to short at 2.21 to 1. The 20-day simple moving average is currently in play and if the spot price remains above this indicator then EUR/GBP may move higher with resistance seen at 0.8658 off the June 28 high.
EUR/GBP Daily Price Chart – July 17, 2023
What is your view on the EURO – bullish or bearish?? You can let us know via the form at the end of this piece or you can contact the author via Twitter @nickcawley1.


