
- Fantom price is contained inside a descending parallel channel on the 12-hour chart.
- Only one crucial resistance level separates the digital asset from a colossal breakout.
- The number of whales holding the coin has significantly spiked in the last week.
Fantom had a massive rally toward $0.90 on February and has been under consolidation ever since. The digital asset is on the verge of a new leg up as it faces just one crucial resistance point ahead.
On the 12-hour chart, Fantom has formed a descending parallel channel which can be drawn by connecting the lower highs and lower lows with two parallel trend lines.

FTM/USD 12-hour chart
A breakout above $0.50 would quickly drive FTM toward $0.62 initially and as high as $0.72 in the longer-term. The In/Out of the Money Around Price (IOMAP) shows only one crucial resistance level at $0.50 as well, where 288 addresses purchased 316 million FTM.
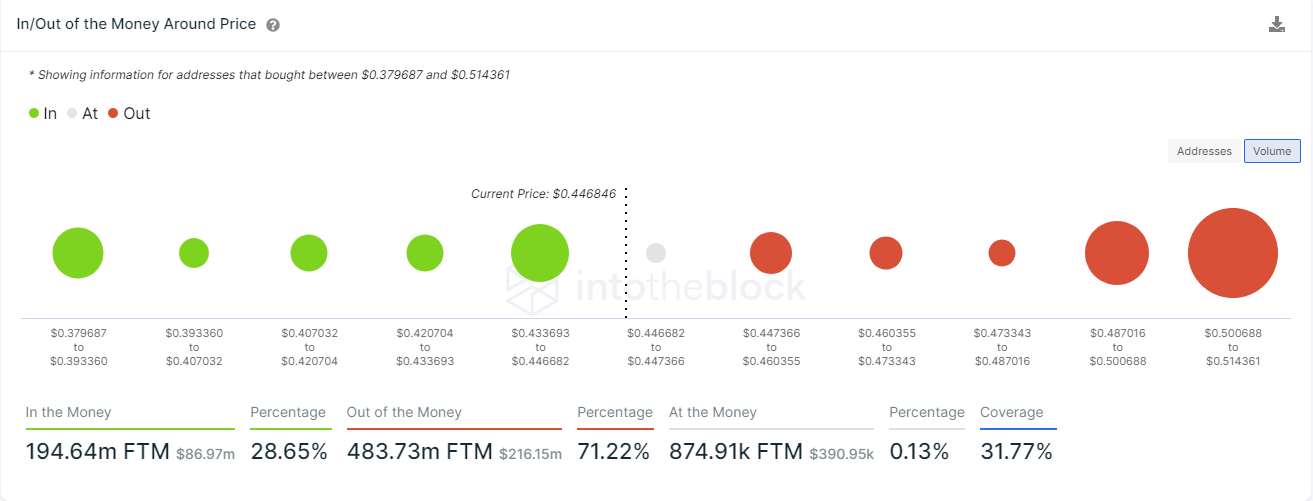
FTM IOMAP chart
Additionally, the number of whales holding between 1,000,000 and 10,000,000 FTM has significantly increased over the last week by six. This is significant because Fantom price also increased in the same period of time.
%20[18.15.59,%2027%20Apr,%202021]-637551318015682541.png)
FTM Supply Distribution
To invalidate the bullish outlook, bears will need to stop FTM from climbing above $0.50 which is the key resistance level.
A rejection from this point will likely push Fantom price down to $0.35 in the short-term and as low as $0.21 at the lower trend line of the pattern.