

GBP/USD Analysis and Charts
UK jobs market stalls, real average earnings remain positive.Tomorrow’s UK inflation report looks key for Sterling.Cable may test the 1.2300 area.
Most Read: British Pound Weekly – Will UK Data Help Stem the Latest GBP/USD Sell-Off?
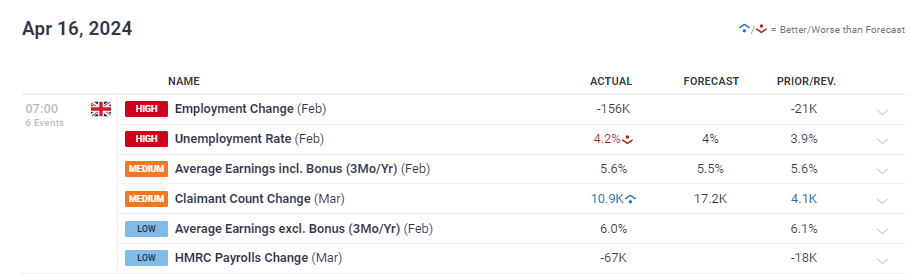
According to the latest Office for National Statistics data, the UK unemployment rate reaches 4.2% in February, surpassing market expectations of 4.0% and the previous month’s reading of 3.9%. Average earnings, including bonuses, remain unchanged at 5.6%, while earnings excluding bonuses decrease slightly by 0.1% to 6.0%. The current UK labor market statistics demonstrate a slight uptick in unemployment and a stable wage growth trend, providing insights into the country’s economic health and employment landscape.
For all market-moving economic data and events, see theDailyFX Economic Calendar
You can download our brand new Q2 British Pound Technical and Fundamental Forecasts below;
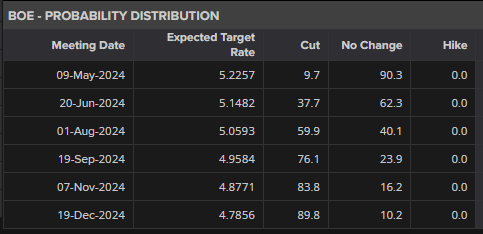
The upcoming UK inflation report for March is now crucial for the short- to medium-term outlook of the British Pound (GBP). The UK inflation rate has been declining rapidly over the past year after touching 10.4% in March of the previous year. Analysts expect the headline UK inflation to drop further, from 3.4% in February to 3.1% in March, bringing it closer to the Bank of England’s (BoE) target of 2%. The central bank is closely monitoring this release and may signal that interest rate cuts could happen sooner than anticipated. Current market expectations indicate a 60% probability of a 25 basis point cut at the BoE’s meeting on August 1st. If the inflation rate continues to fall, this probability is likely to increase. The March UK inflation data will play a significant role in shaping the GBP’s performance and influencing the BoE’s monetary policy decisions in the coming months.
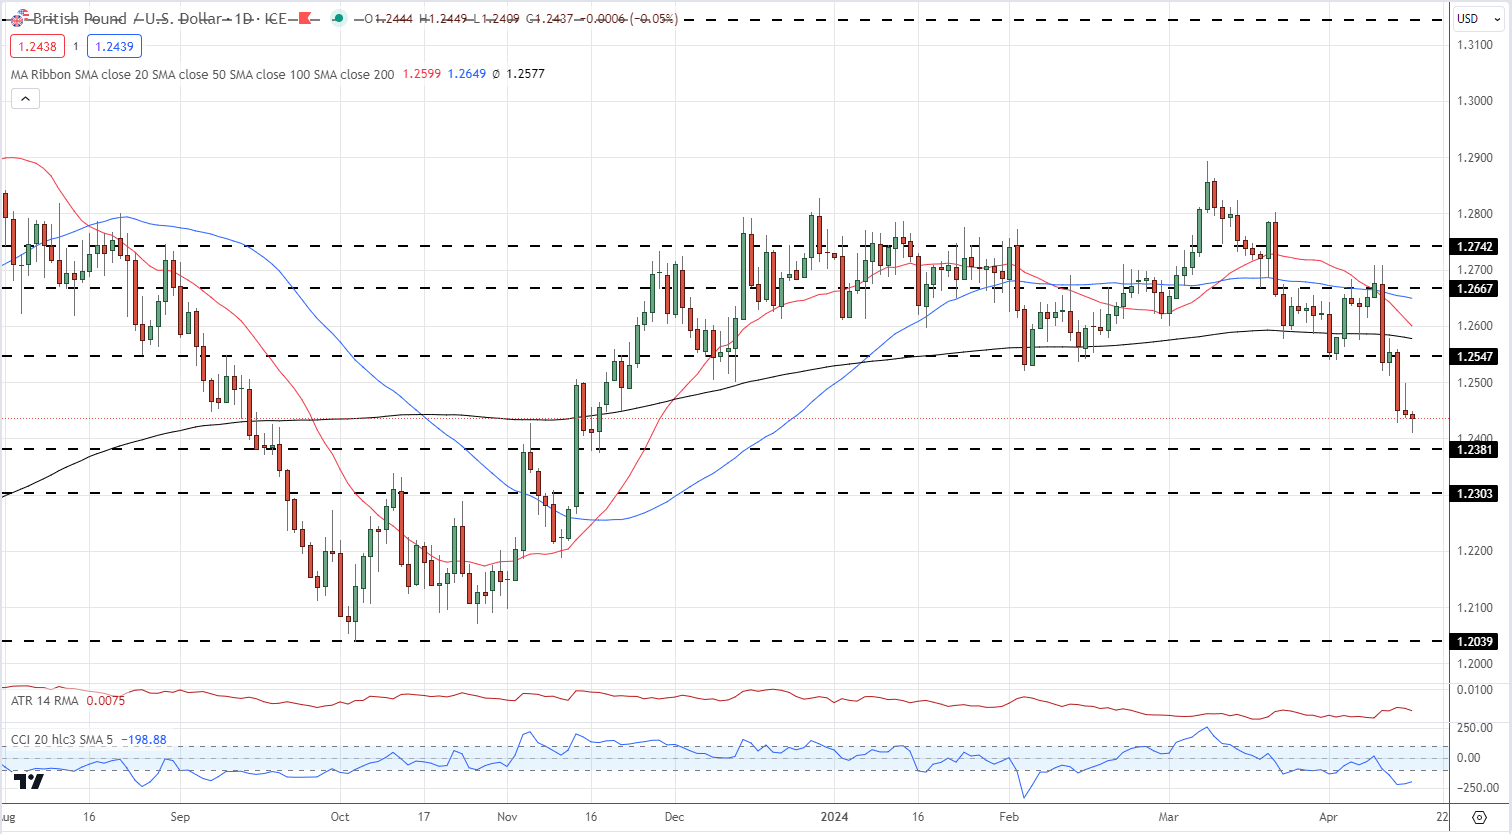
As the US dollar strengthens and the British Pound (GBP) weakens, the GBP/USD currency pair’s path of least resistance continues to trend lower. The recent break below all three simple moving averages on Wednesday has contributed to the negative market sentiment surrounding the GBP/USD. Furthermore, the pair has easily broken through previous support levels around 1.2547 and the significant psychological level of 1.2500. Technical analysis of the GBP/USD chart reveals the next two support levels at 1.2381 and 1.2303, which may be tested soon. Traders and investors closely monitor these key levels to gauge the GBP/USD’s performance and potential trading opportunities in the current market environment, characterized by a robust US dollar and a weakening Sterling.
GBP/USD Daily Price Chart
IG Retail data shows 67.80% of traders are net-long with the ratio of traders long to short at 2.11 to 1.The number of traders’ net long is 2.78% lower than yesterday and 35.65% higher than last week, while the number of traders’ net short is 7.65% higher than yesterday and 31.33% lower than last week.
We typically take a contrarian view to crowd sentiment, and the fact traders are net-long suggests GBP/USD prices may continue to fall.
See How Changes in IG Client Sentiment Can Help Your Trading Decisions
What is your view on the British Pound – bullish or bearish?? You can let us know via the form at the end of this piece or you can contact the author via Twitter @nickcawley1.
DailyFX provides forex news and technical analysis on the trends that influence the global currency markets.


