
Gold Fundamental Forecast: Gold Glowing into Q2 as Fed Peaks
CBOE GOLD ETF VOLATILITY INDEX (GVZ) – 2023
SPDR GOLD TRUST (GLD) TRADED VOLUMES (2022-2023)
FOMC Dot Plot March 22nd, 2023
Gold Fundamental Forecast: Gold Glowing into Q2 as Fed Peaks
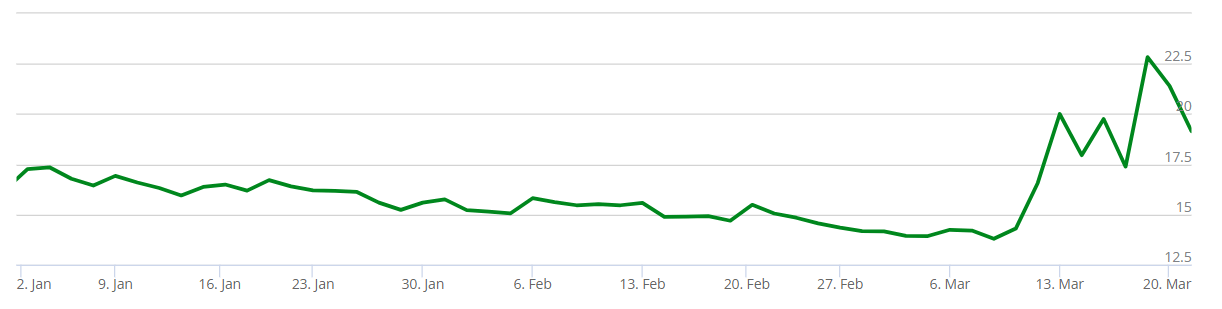
Moving into the second quarter of 2023, gold prices are gaining traction in line with the global banking crisis and uncertainty surrounding the Federal Reserve. Contagion risks from financial market fears have allowed the safe-haven appeal of gold to drive bulls to the cause but this can be fleeting for a quarterly period. Increased volatility has been another contributor to shinier bullion as measured by the GVZ chart below. This measures the market’s expected 30-day price movement in the SPDR Gold Trust (the largest physically backed gold exchange traded fund (ETF) in the world).
CBOE GOLD ETF VOLATILITY INDEX (GVZ) – 2023
Source: Cboe.com
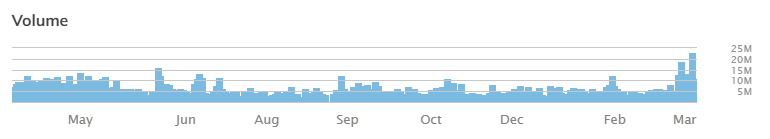
The latest volumes for GLD support the recent upside with volumes flowing into the fund steadily rising throughout March, highlighting the mostly positive association between GVZ and GLD respectively. The question remains, will this trend continue through Q2 or not?
SPDR GOLD TRUST (GLD) TRADED VOLUMES (2022-2023)
Source: ETF.com
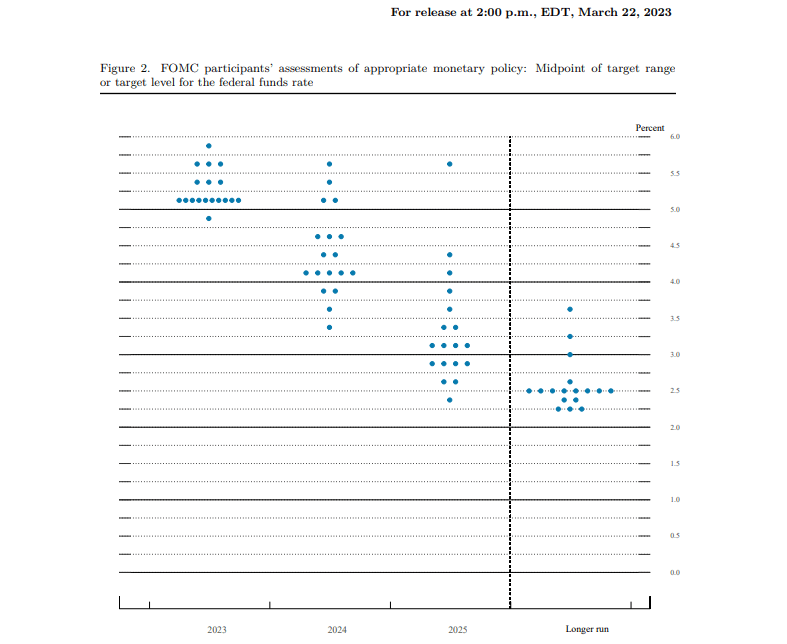
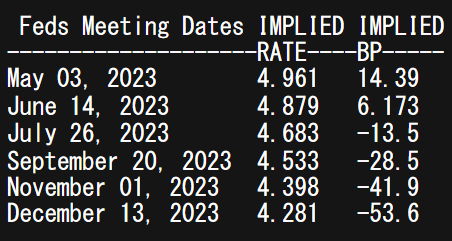
That brings us to the March FOMC rate decision where interest rates were raised by 25bps to 5% in a tight labor market environment alongside elevated inflationary pressures. The updated Fed dot plot is shown in the graphic below and is currently backed by money market pricing shown via the Fed funds implied interest rate probabilities. It seems that we have reached the peak at 5%; however, with inflation still ‘sticky’ and the US economy relatively robust, it leaves the Fed with a tough decision ahead to quell inflation.
FOMC Dot Plot March 22nd, 2023
Source: Federal Reserve
FED FUNDS RATE PROBABILITIES
Source: Refinitiv
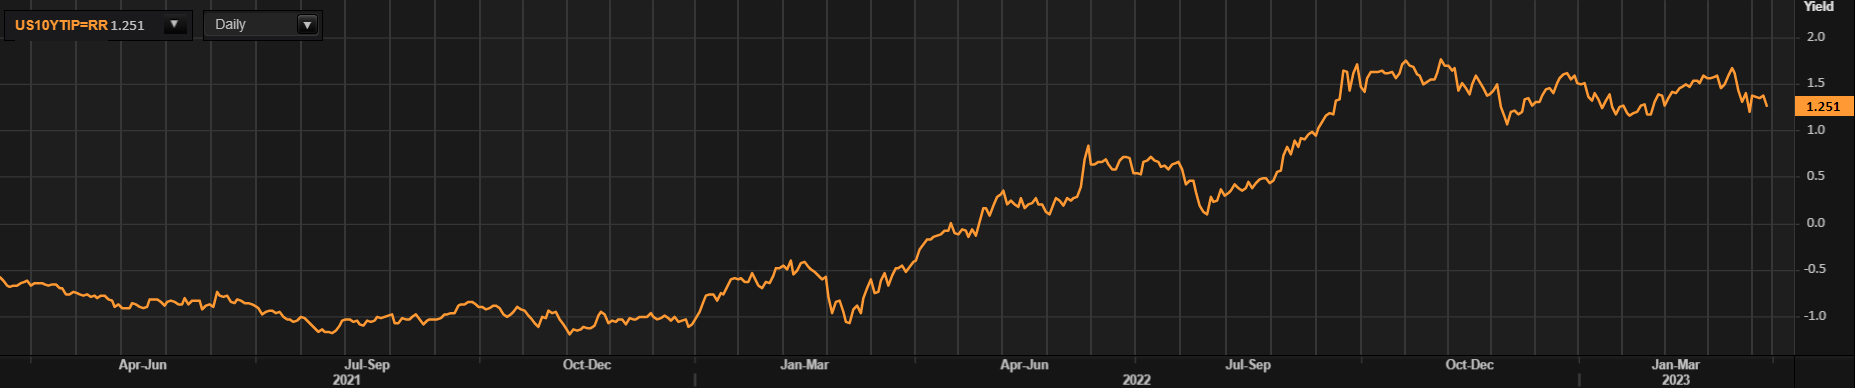
Real yields are perhaps the most influential variable for gold prices bearing in mind that the yellow metal is non-interest bearing and therefore reacts negatively to higher interest rates and US real yields. Since, late 2022, real yields have been constrained between 1% – 1.75% with no real directional bias, but with the recent forward guidance from the Fed, real yields may track lower throughout Q2, leaving gold unyielding to downside stresses.
U.S. 10-YEAR REAL YIELD
Source: Refinitiv
Summing up the current market setting, the potential for higher gold prices is more likely, especially if inflation data shows signs of decline in the midst of a topping US central bank hiking cycle. Economic data points will be key moving forward during this cautious period, resulting in the possibility of a more rangebound move until further clarity is secured.
DailyFX provides forex news and technical analysis on the trends that influence the global currency markets.


