
Delta doom and gloom – the highly transmissible coronavirus variant adds to market worries, which include fear that inflation is rearing its ugly head. Is Gold a hedge against rising costs? That remains an open question. On the one hand, if currencies lose value, the precious metal becomes more valuable. On the other hand, central banks could raise interest rates and make yieldless gold less attractive as a haven.
XAU/USD has held up surprisingly well in the face of Thursday’s stock market decline, and as the weekend approaches, technicals are coming into play.
How is gold positioned?
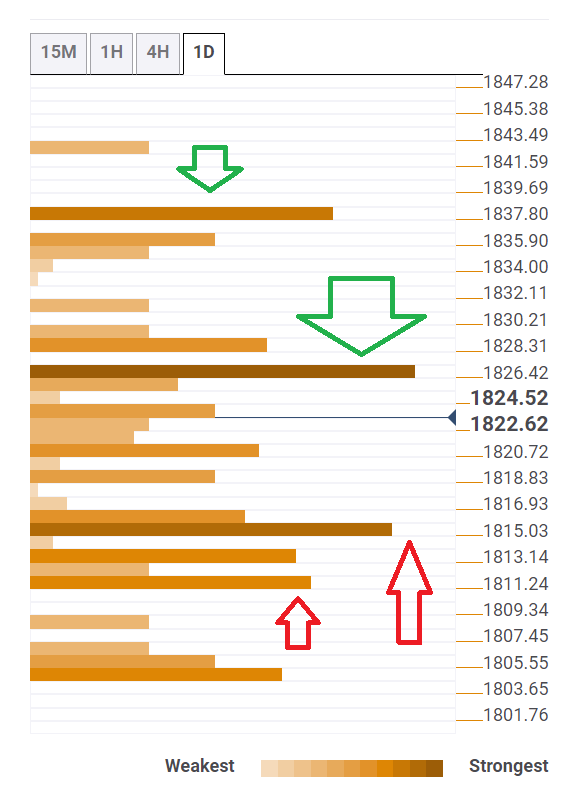
The Technical Confluences Detector is showing that XAU/USD has substantial support at $1,815, which is the convergence of the Fibonacci 38.2% one-month and the Pivot Point one-day Support 2.
The top of the range is defined by a dense cluster of lines at $1,826, which includes the Fibonacci 61.8% one-day, the Bollinger Band 1h-Middle, the Simple Moving Average 200-15m and more.
Beyond the $1815-1826 range, there are additional noteworthy levels to watch in case of a breakout. Looking up, bulls eye $1,837, which is where the 50-day SMA and the PP one-week S2 meet.
On the downside, $1,811 is the confluence of the SMA 200-1h, the Fibonacci 23.6% one-week and the SMA 50-4h.
The Confluence Detector finds exciting opportunities using Technical Confluences. The TC is a tool to locate and point out those price levels where there is a congestion of indicators, moving averages, Fibonacci levels, Pivot Points, etc. Knowing where these congestion points are located is very useful for the trader, and can be used as a basis for different strategies.