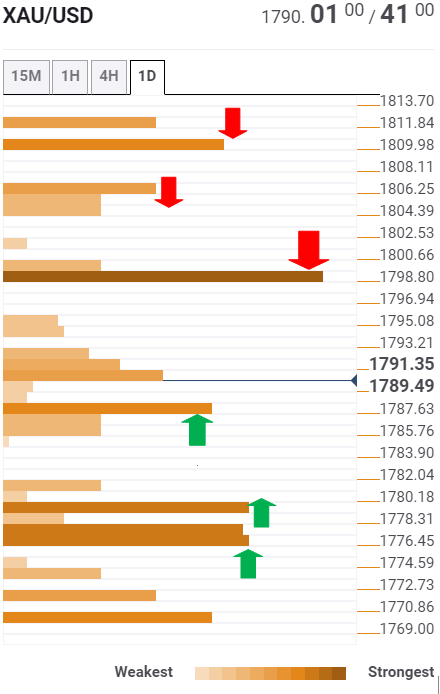
Gold (XAU/USD) is easing off three-month highs, as the bulls face a hurdle at the technical resistance near the $1798-$1799 zone. Broad-based US dollar bounce amid a risk-off mood and upbeat comments from Fed Chair Powell weigh on gold. Although the XAU bulls remain hopeful amid subdued Treasury yields. Gold traders look forward to the US ISM-NY Business Conditions and Factory Orders after the ISM Manufacturing data disappointed markets.
How is gold positioned on the technical graphs?
The Technical Confluences Detector shows that gold is facing minor resistance around the $1793-$1795 region, which is the convergence of the previous high four-hour and Fibonacci 23.6% one-day.
The XAU buyers need to find a strong foothold above $1798, the confluence of the SMA100 one-day, previous month highs and the previous day high, in order to extend the resurgent demand.
The next stop for the bulls is seen at the pivot point one-week S2 at $1806.
Further north, the pivot point one-month R1 at $1810 will be on the buyers’ radars.
On the flip side, strong support awaits $1787, where the SMA5 four-hour coincides with the pivot point one-week R1.
The intersection of the SMA200 one-hour, Fibonacci 61.8% one-day and SMA5 one-day at $1780 could limit the declines.
Meanwhile, the confluence of the Fibonacci 61.8% one-week, Fibonacci 23.6% one-month and SMA100 one-hour at $1776 could likely be the level to beat for the XAU bears.
The TCD (Technical Confluences Detector) is a tool to locate and point out those price levels where there is a congestion of indicators, moving averages, Fibonacci levels, Pivot Points, etc. Knowing where these congestion points are located is very useful for the trader, and can be used as a basis for different strategies.


