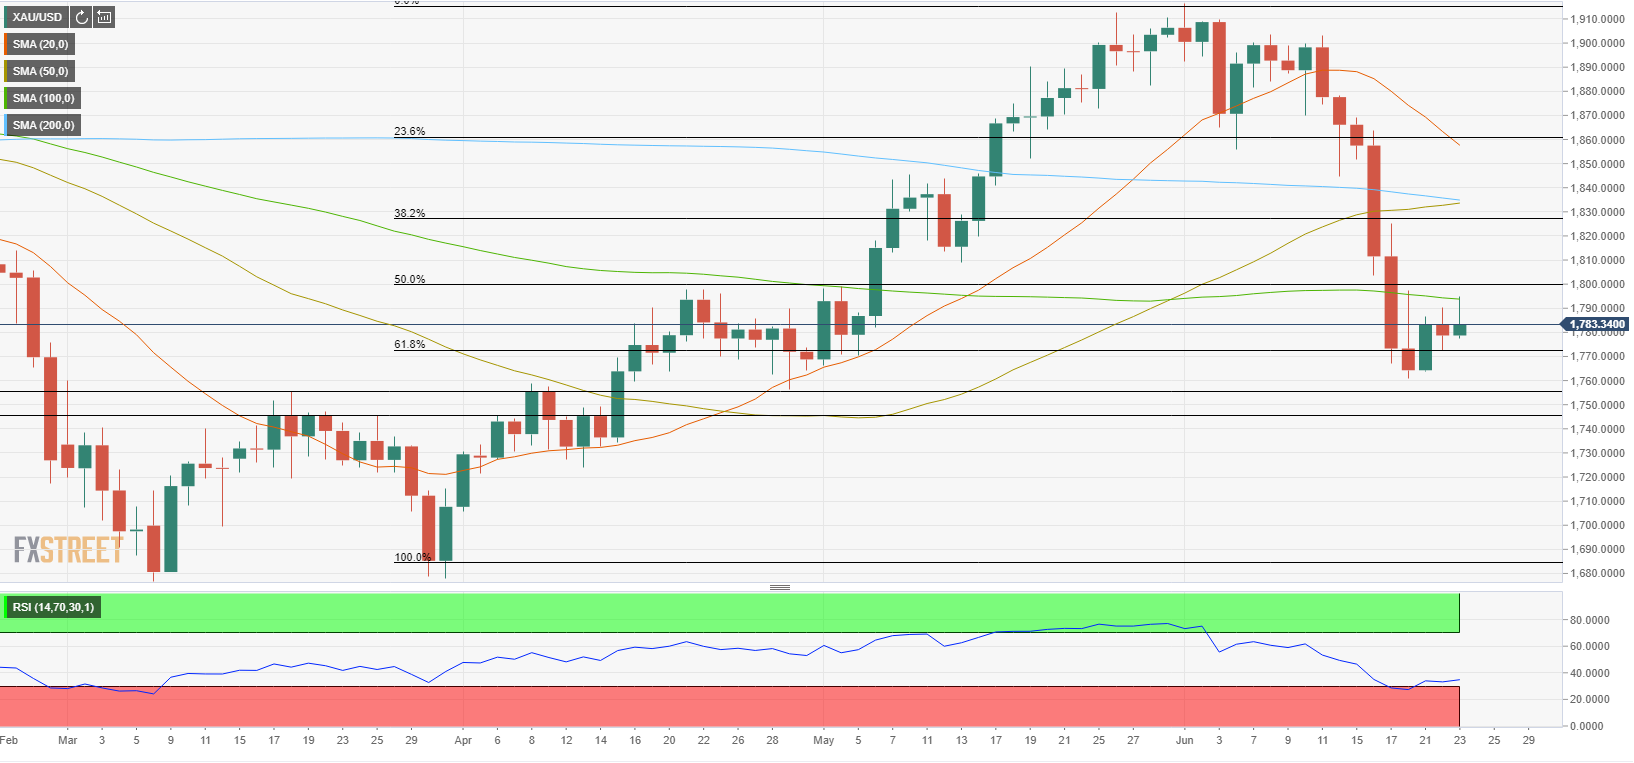
- Gold lost its traction before reaching $1,800 on Wednesday.
- Near-term technical outlook remains bearish with 100-day SMA capping the upside.
- Additional losses are likely with a daily close below $1,770.
The broad-based selling pressure surrounding the greenback during the first half of the day on Wednesday allowed gold to extend its recovery. After touching a daily high of $1,794, however, XAU/USD lost its traction and erased a large portion of its daily gains. As of writing, gold was trading with modest daily gains at $1,783.
While testifying before the House Select Subcommittee on the Coronavirus Crisis on Tuesday, FOMC Chairman Jerome Powell said that “a substantial part or perhaps all of the overshoot” in inflation were from categories directly affected by the reopening. Powell’s comments failed to help the USD find demand and the US Dollar Index closed the second straight day in the negative territory.
On Wednesday, the data from the US showed that the business activity in the manufacturing sector continued to expand at an unprecedented pace with the Markit Manufacturing PMI climbing to a new series-high of 62.6. On a negative note, the Markit Services PMI declined to 64.8 from 70.4 in May and missed the market expectation of 70. In the publication, Chris Williamson, Chief Business Economist at IHS Markit, noted that the economy continues to run hot as prices charged for goods and services continue to rise very sharply.
In the meantime, Atlanta Federal Reserve President Raphael Bostic said he revised his 2021 inflation forecast higher to 3.4% and added that he expects a liftoff in the policy rate in 2022 before two more hikes in 2023.
Following the mixed macroeconomic data releases and Bostic’s hawkish remarks, the USD started to regather strength and caused XAU/USD to turn south.
On the daily chart, the 100-day SMA continues to act as dynamic resistance a little below the $1,800 psychological level. Unless gold manages to make a daily close above that level, the recovery is likely to gather momentum. Additionally, the Relative Strength Index on the daily chart holds below 40, suggesting that there is more room on the downside before the pair becomes technically oversold.
The initial support is located at $1,770 (Fibonacci 61.8% retracement of April-June uptrend) ahead of $1,756 (April 29 low, static level) and $1,745 (static level).
On the upside, $1,825 (Fibonacci 38.2% retracement) and $1,835 (200-day SMA) could be seen as significant hurdles in case gold breaks above $1,800.