
Gold Technical Price Outlook: XAU/USD Near-term Trade Levels
Gold prices surged more than 12.6% off the March / yearly low with XAU/USD probing confluent uptrend resistance today. At the same time, a collapse in cryptocurrencies has fueled a wave of selling with Bitcoin in free fall in early US trade. The weekly opening-range is set in gold and we’re looking for a breakout for guidance with the broader focus higher while above the weekly open. These are the updated targets and invalidation levels that matter on the XAU/USD and BTC/USD technical charts. Review my latest Strategy Webinar for an in-depth breakdown of this gold technical setup and more.
Gold Price Chart – XAU/USD Daily

Chart Prepared by Michael Boutros, Technical Strategist; Gold on Tradingview
Technical Outlook: In my last Gold Price Outlook we noted that a May breakout was imminent as XAU/USD carved a, “well-defined weekly opening-range between 1763-1795, a zone that has governed gold prices since April 16th – we’re on breakout watch.” A topside breach / close above the April range-highs the following day fueled a rally of more than 6.3% month-to-date with the advance now probing confluence channel resistance at 1876- a level defined by the 100% extension of the March advance, the 50% retracement of the August decline and the late-January high. Note that daily momentum is now probing the 70-threshold as price approaches resistance – the trigger is set, watch the close.
Gold Price Chart – XAU/USD 120min
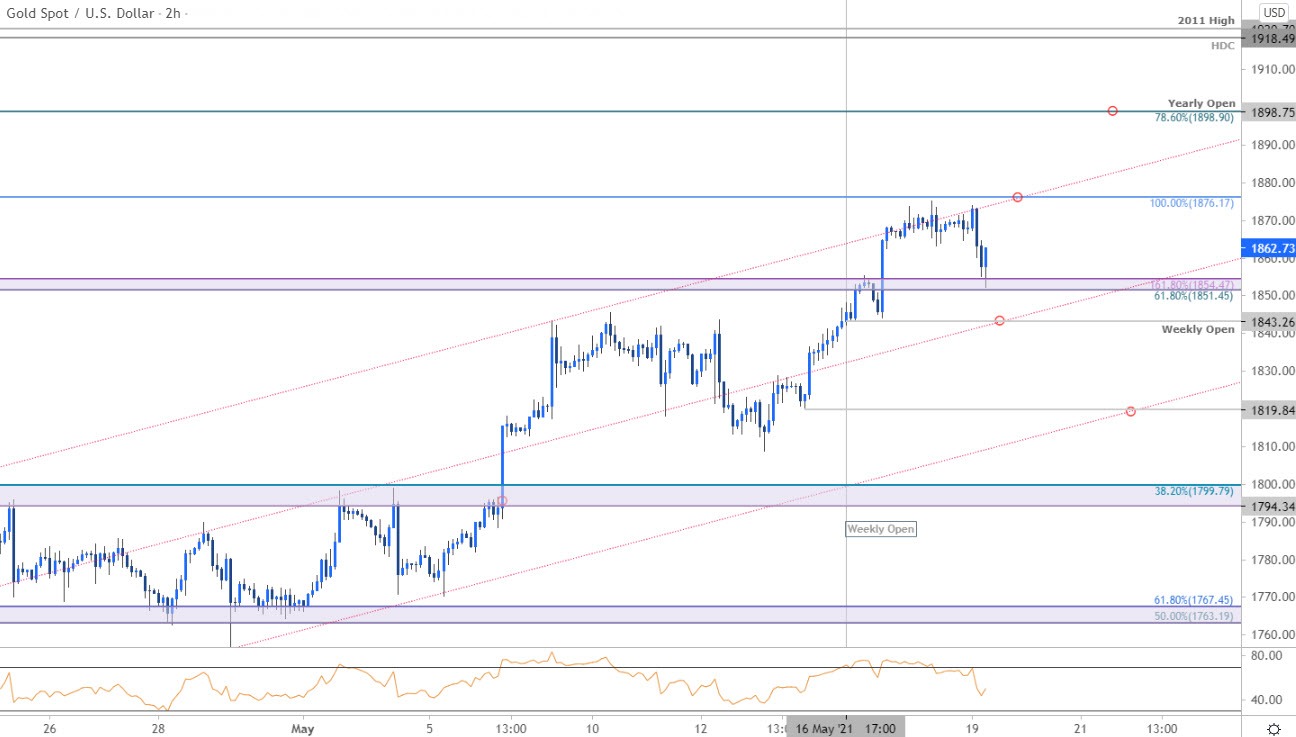
Notes: A closer look at Gold price action shows XAU/USD carving the weekly opening-range just below the upper parallel / resistance at 1876. A topside breach here keeps the focus on subsequent resistance objectives at the yearly open / 78.6% retracement at 1898 backed by the yearly high-day close / 2011 high / 61.8% Fibonacci retracement at 1918/23- both levels of interest for possible topside exhaustion IF reached. Initial support rests at 1851/54 with near-term bullish invalidation now raised to the weekly open at 1843. Ultimately a close below Friday’s low at 1819 would be needed to reassert the short-side bias.
Bottom line: The gold price rally is probing confluence resistance here at 1876 and we’re looking for possible inflection here. From a trading standpoint, a good zone to raise protective stops – losses should be limited to the weekly open IF prices is heading higher on this stretch. Keep in mind the technical significance of this threshold may fuel another accelerate inflection run here- stay nimble into the close of the week. Review my latest Gold Weekly Price Outlook for a closer look at the longer-term XAU/USD technical trading levels.
For a complete breakdown of Michael’s trading strategy, review his Foundations of Technical Analysis series on Building a Trading Strategy
Gold Trader Sentiment – XAU/USD Price Chart
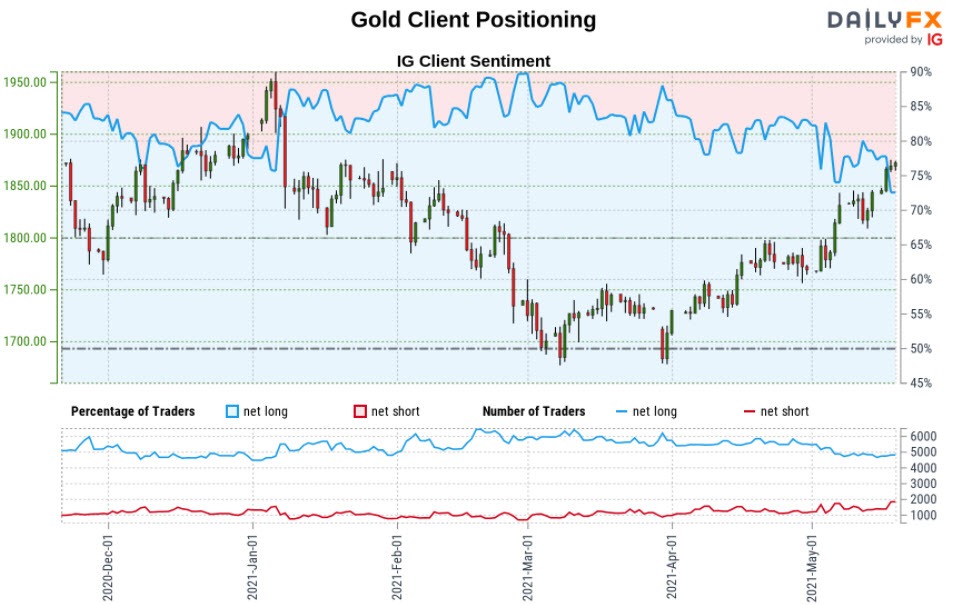
- A summary of IG Client Sentiment shows traders are net-long Gold- the ratio stands at +2.6 (72.20% of traders are long) – typically bearishreading
- Long positions are1.50% lower than yesterday and 0.15% lower from last week
- Short positions are13.07% higher than yesterday and 27.63% higher from last week
- We typically take a contrarian view to crowd sentiment, and the fact traders are net-long suggests Gold prices may continue to fall. Yet traders are less net-long than yesterday and compared with last week. Recent changes in sentiment warn that the current Gold price trend may soon reverse higher despite the fact traders remain net-long.
Bitcoin Price Chart – BTC/USD Daily
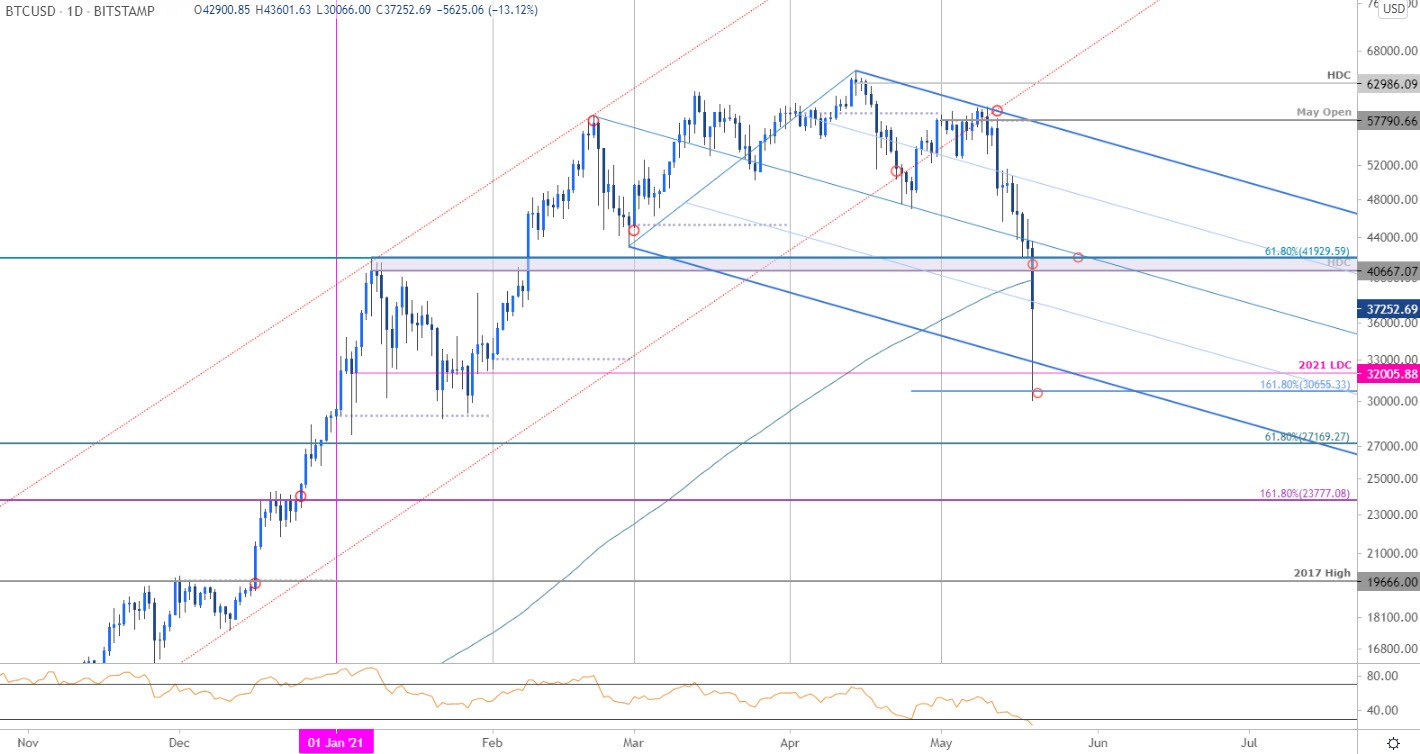
Chart Prepared by Michael Boutros (log scale), Technical Strategist; Bitcoin on Tradingview
Notes: Bitcoin broke below critical support today at the January high-day close / 61.8% retracement of the yearly range at 40667-41929 with the move also taking out the 200-day moving average for the first time since April 2020 and marking the largest single-day range (ATR) on record in BTC/USD . The sell-off was halted in early US Trade at the 1.618% extension / 2021 low-day close at 30655-32005 – this support zone remains critical. Likely to see some chop here in the days ahead with bearish invalidation now lowered to the median-line / 40667-41930. A break lower form here would risk a test of the yearly range lows / the 61.8% retracement of the 2020 advance at 27169/734.
—
Active Technical Setups
– Written by Michael Boutros, Technical Strategist with DailyFX
Follow Michael on Twitter @MBForex