
Gold, XAU/USD, US Dollar, Treasury Yields, iShares High Yield ETF, GVZ Index – Talking Points
The gold price has backed away from the psychological US$ 2,000 markWhile robust Treasury yields remain, US companies are facing a debt squeezeImplied and historical volatility is on the rise. Will XAU/USD break higher?
The gold price eased to start the week after posting solid gains on perceived haven flows outweighing the higher yields on government bonds across most of the globe.
While the geopolitical situation in the Middle East assisted in undermining growth and risk-orientated assets such as equities, parts of the fundamental macroeconomic backdrop could have also played a role in the precious metal’s rally.
Using the iShares iBoxx High Yield Corporate Bond Fund Exchange Traded Fund (ETF) as a proxy for credit, we can see the deterioration in the outlook for corporate bonds.
The ETF has fallen to levels that were seen in the aftermath of the Silicon Valley Bank collapse. The squeeze on credit also saw Wall Street equity indices take a bath and the lift in risks for other assets may have contributed to the benefit of the gold price.
Unfortunately, the situation in the Middle East does not appear likely to find a peaceful resolution anytime soon and this might keep the bid tone for the yellow metal for now despite higher Treasury yields.
The monetary policy-sensitive 2-year Treasury note traded at 5.25% last Thursday for the first time since 2006 before collapsing toward 5.10% to close out the week.
Similarly, the benchmark 10-year note traded at its highest level since 2007, nudging over 5.0% before retreating to around 4.95%.
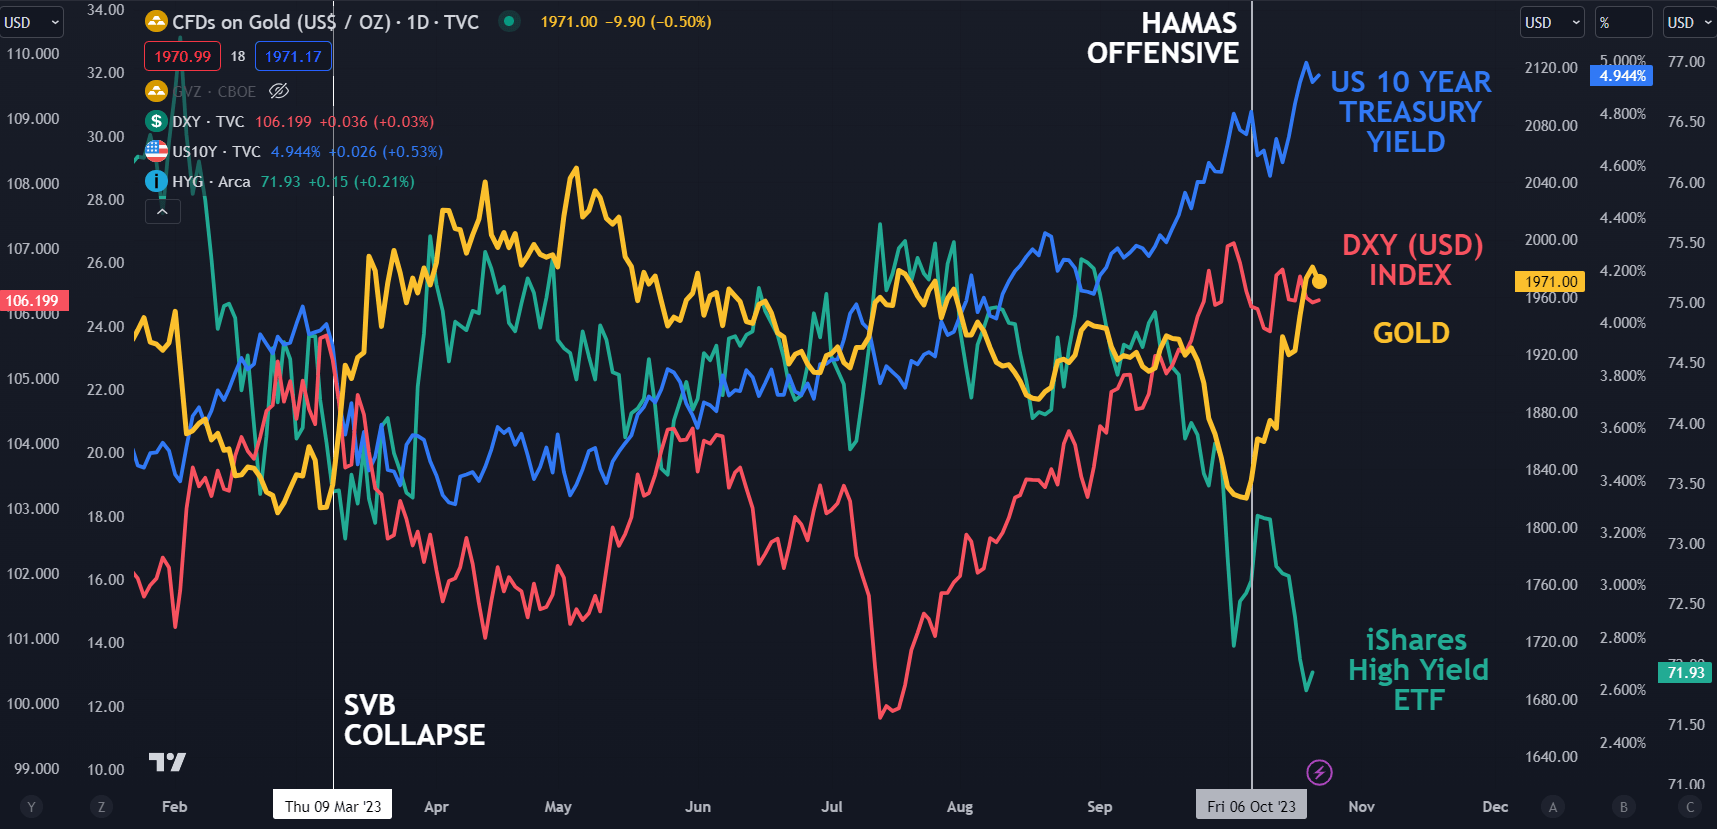
Looking at the chart below, the elevated 10-year Treasury yields and DXY (USD) index are yet to impact the gold price, but it might be worth watching should those markets move abruptly.
It’s possible that the sell-off in the iShares high-yield ETF could have broader implications for equities as debt financing becomes more expensive for companies.
SPOT GOLD, DXY (USD) INDEX, US 10-YEAR TREASURY AND iShares iBoxx HIGH YIELD ETF
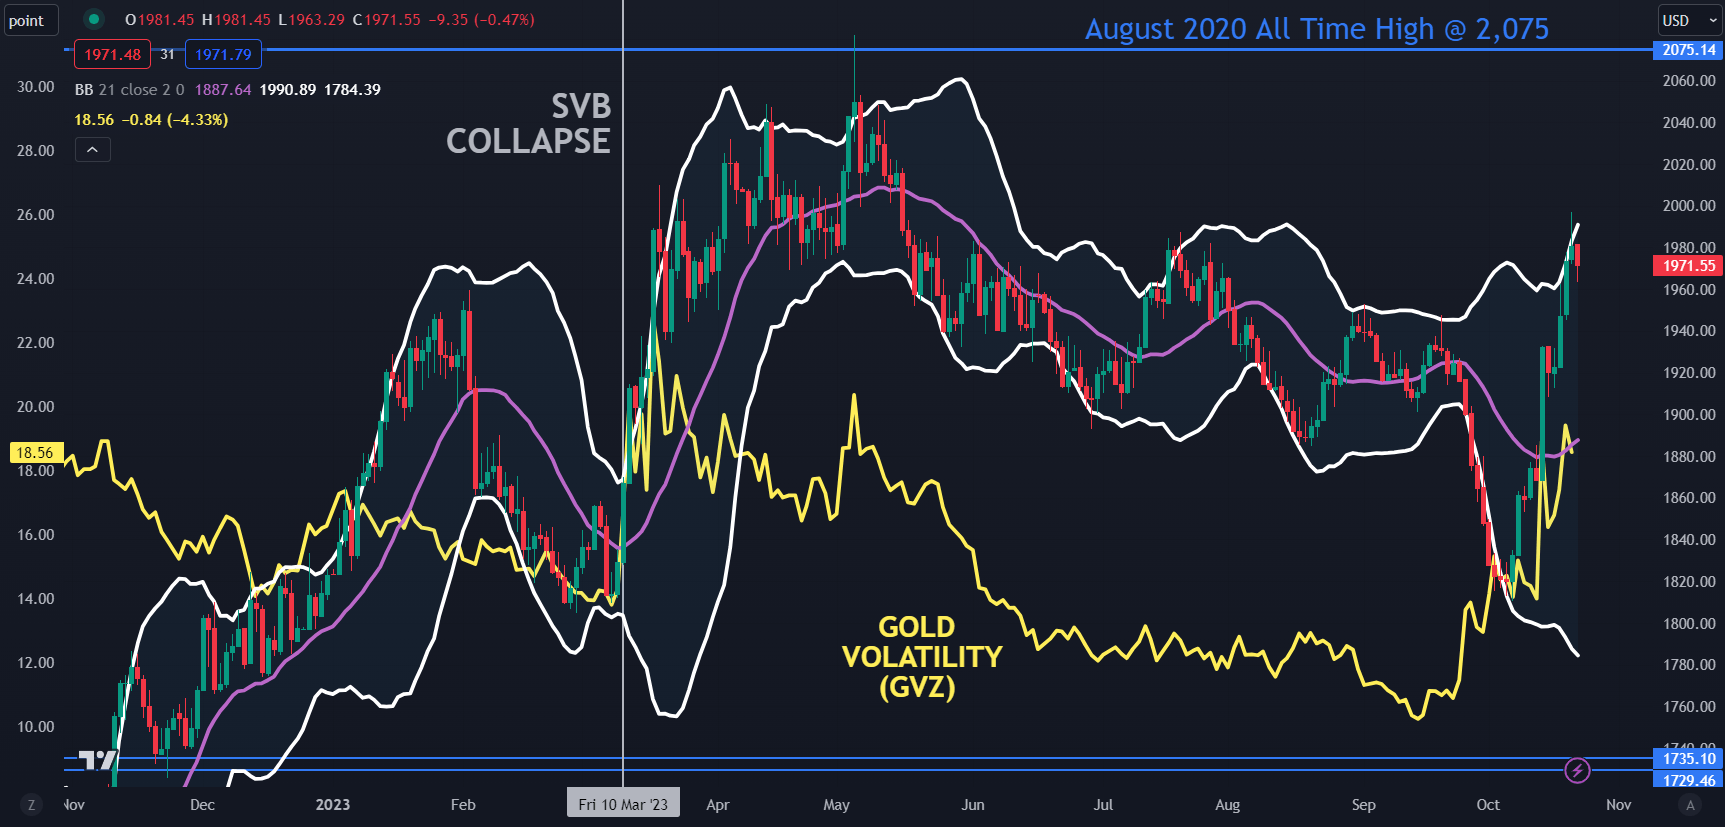
All this price action across markets has seen gold volatility tick higher as measured by the GVZ index. The GVZ index measures implied volatility in the gold price in a similar way that the VIX index gauges volatility in the S&P 500.
At the same time, the width of the 21-day simple moving average (SMA) basedBollinger Bands. has expanded. The Bolling Bands represent historical volatility. To learn more about trading Bollinger Bands, click on the banner.
SPOT GOLD, BOLLINGER BANDS AND GVZ INDEX
— Written by Daniel McCarthy, Strategist for DailyFX.com
Please contact Daniel via @DanMcCathyFX on Twitter
DailyFX provides forex news and technical analysis on the trends that influence the global currency markets.

