
Three big banks kicked off earnings season Wednesday morning with Goldman Sachs Group Inc (NYSE: GS), JPMorgan Chase & Co. (NYSE: JPM) and Wells Fargo & Company (NYSE: WFC) reporting strong first-quarter 2021 results.
The banking sector had been in a strong uptrend that started in November 2020, with stocks reaching new highs late March and falling into stages of consolidation. By the looks of Wednesday’s price action, traders and investors are excited by the three bank’s earnings reports.
Goldman Sachs reported EPS of $18.60 versus the Street’s expectation of $10.20 and reported revenue of $17.7 billion, exceeding the consensus by more than $5 billion.
JPMorgan reported EPS of $4.50 versus the Street’s expectation of $3.08 and reported revenue of $33.12 billion, exceeding the consensus by more than $2.5 billion.
Wells Fargo reported revenue of $18.05 billion, beating the Street’s estimate of $17.5 billion and EPS of $1.05 against an estimate of 69 cents.
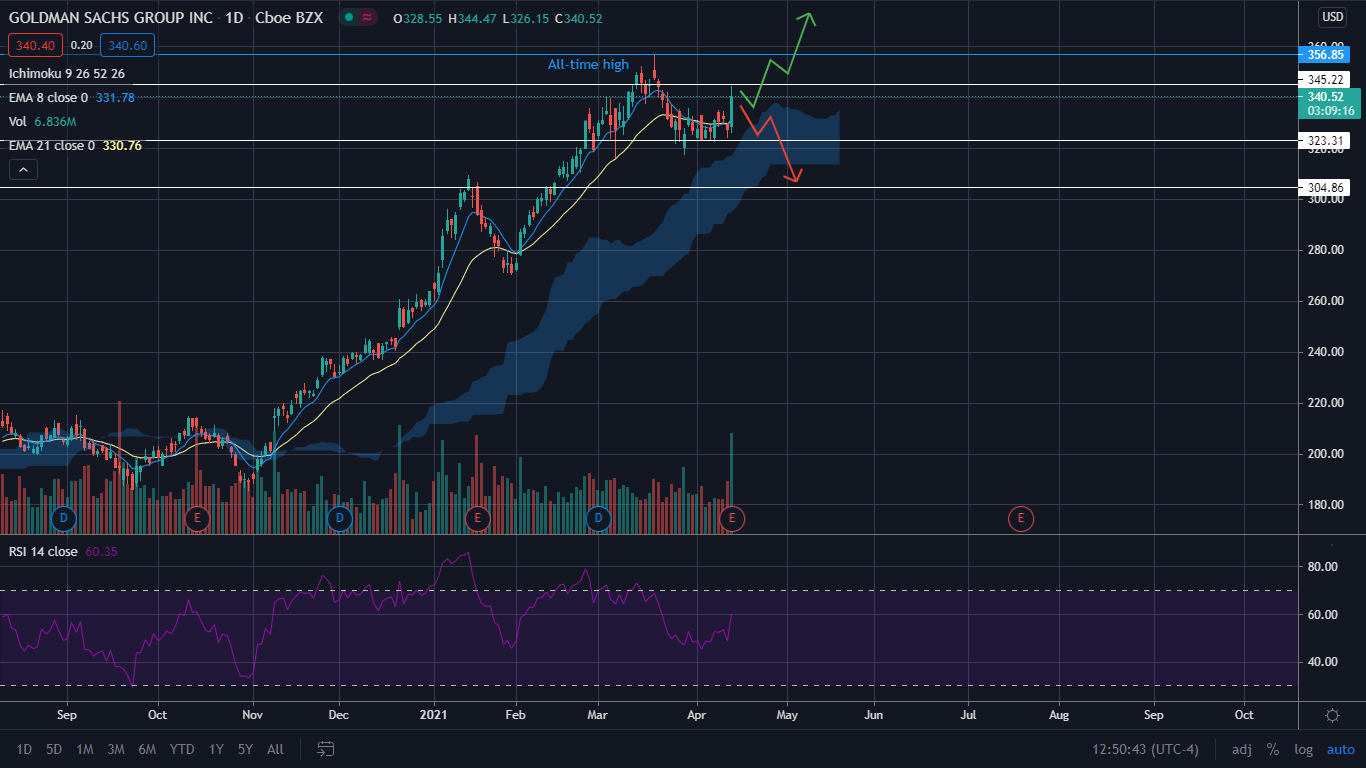
The Goldman Sachs Chart: Shares of Goldman Sachs shot up 4% by midday Wednesday, hitting a resistance at $345.22 and rejecting.
The big move up caused the eight-day exponential moving average (EMA) to cross above the 21-day EMA, which is bullish. After trading sideways for 16 trading days, the market was likely waiting for Goldman Sachs’ earnings report before making a decision on the stock’s direction.
Bulls want to see consolidation take place under $345.22 for the stock to gather power and break through it for a move back up test the all-time high of $356.85 made on March 18. If the stock can bust to a new all-time high with big bull volume, it could continue to run higher.
Bears want to see a sustained move back down to the $323.31 support level and then for the stock to fall below it. If Goldman Sachs’ stock can’t hold support, there it could fall further toward $304.36, which is its next area of support.
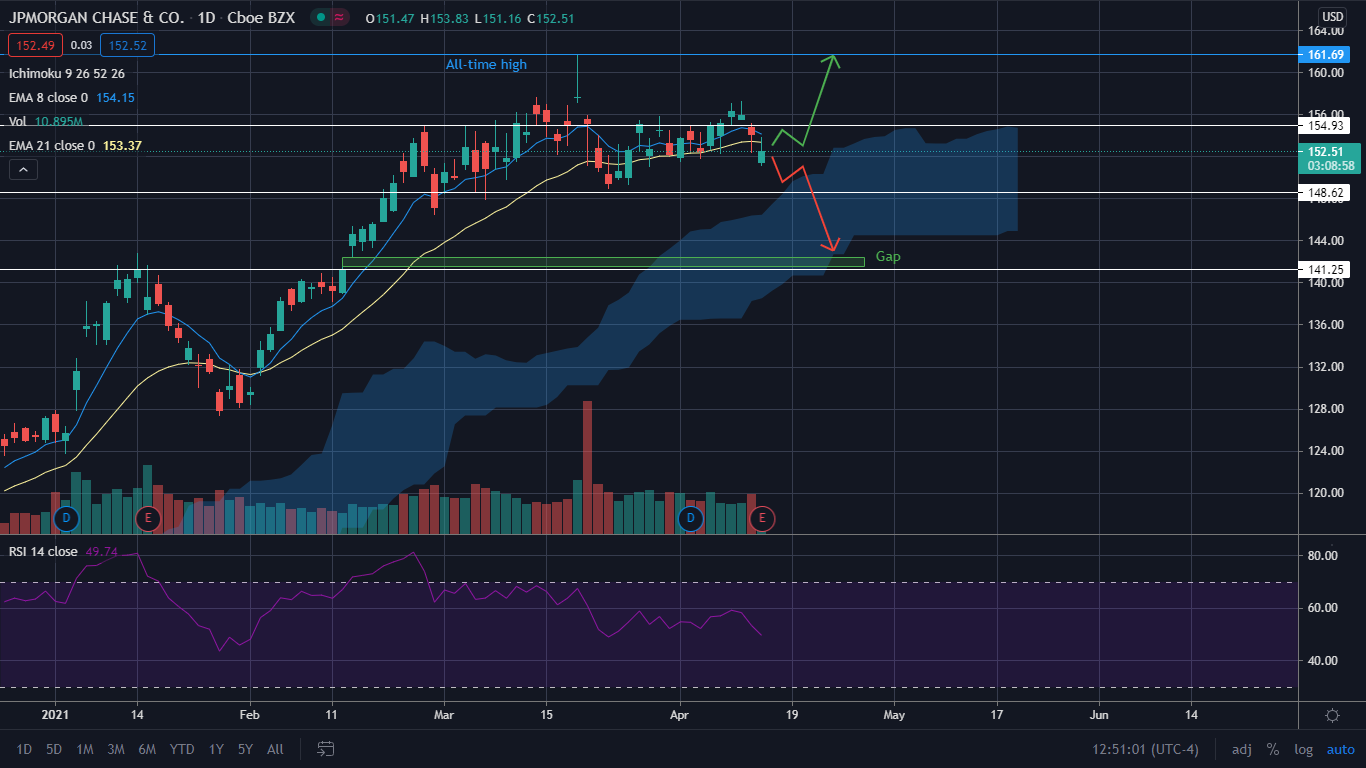
 The JPMorgan Chart: JPMorgan’s stock gapped down 1.65% Wednesday, opening at $151.16. Bulls entered immediately and bought the dip, which then closed the gap.
Like Goldman Sachs, JPMorgan’s stock has been trading sideways for 16 trading days as the market waited for earnings results. JPMorgan is trading below both the eight-day and 21-day EMAs, which is bearish, but this could change if the stock was able to jump above resistance at $154.93.
At midday, JPMorgan was printing a green inverted hammer candlestick on the daily chart that — coupled with the previous red hammer candlestick from Tuesday — could indicate the stock is setting up a bullish inverted hammer pattern for the next leg up.
Bulls want to see bull volume enter the stock and set up a bearish pattern below resistance to push the stock down to its next support level at $148.62. If it falls below that support, there is a small gap on the chart near the $142 mark that is likely to get filled.
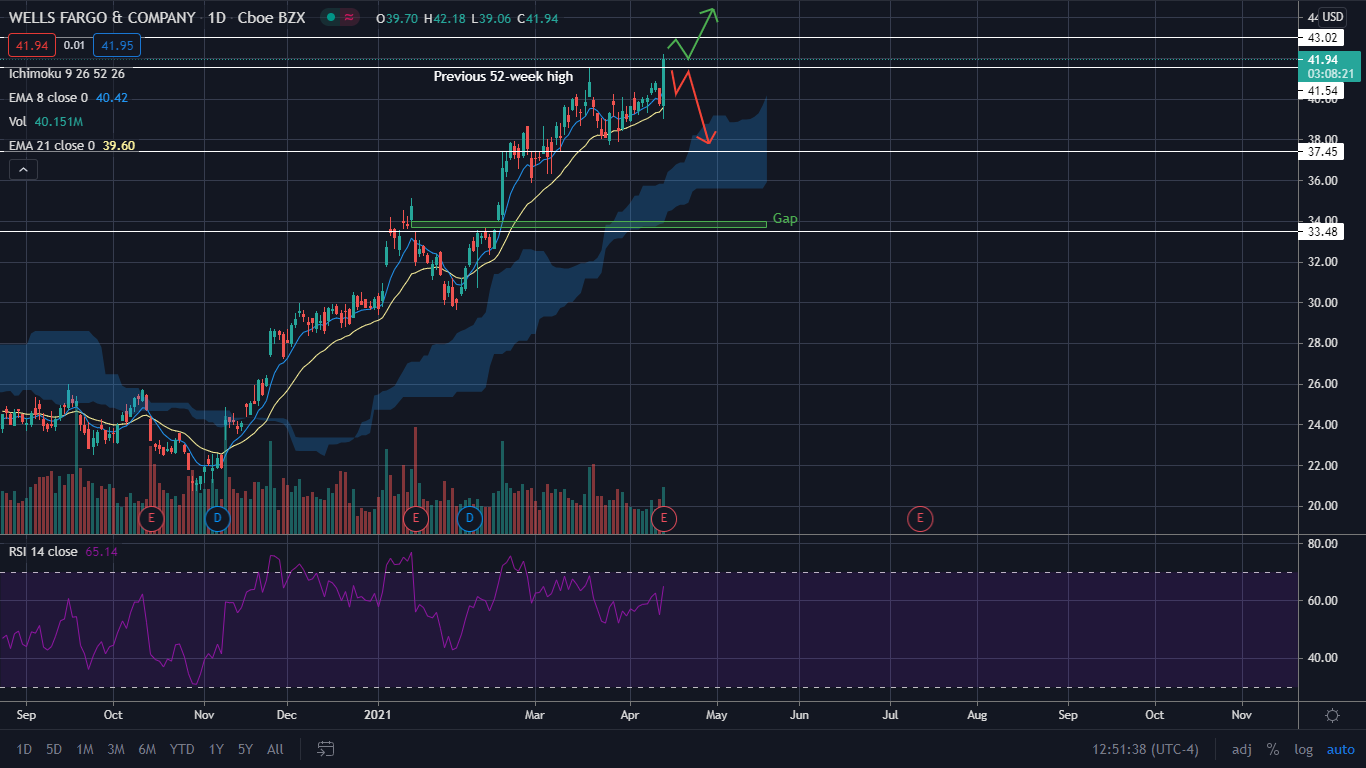
 The Walls Fargo Chart: The strongest of the three banks, Wells Fargo’s stock was trading up over 5% midday and burst through a resistance level at $41.54 to make a new 52-week high. Wells Fargo’s stock is trading above both the eight-day and 21-day EMAs, which is bullish.
Bulls want to see JPMorgan continue to trade above its $41.54 resistance level and for it to become stronger support. If the stock can gather momentum, it could reach $43.02, and from there it’s smooth sailing until the $46.75 mark, which would be in-line with pre-pandemic prices.
Bears want to see JPMorgan’s stock lose below resistance and create a bearish pattern that could then force it down to its next support level at $37.45. Bulls would then need to step in to defend that level — or there is a gap that’s been left behind twice, near the $34 mark.
 GS, JPM, WFC Price Action: Shares of Goldman Sachs were trading up 3.03% at $337.63 at last check. JPMorgan shares were down 1.7% at $151.44. Wells Fargo shares were gaining 5.52% to $41.98.
JPMorgan CEO Jamie Dimon. Benzinga file photo by Dustin Blitchok.
(C) 2021 Benzinga.com. Benzinga does not provide investment advice. All rights reserved.