Intel Corp. (NASDAQ: INTC) gapped down Friday morning in the wake of the chipmaker’s first-quarter report.
Intel also issued second-quarter EPS guidelines that undershot Street estimates.
The stock was down 6.27% at $58.64 at last check Friday.
Intel’s CEO said Thursday that the global semiconductor chip supply shortage could stretch two more years. Below is a technical analysis of the chart.
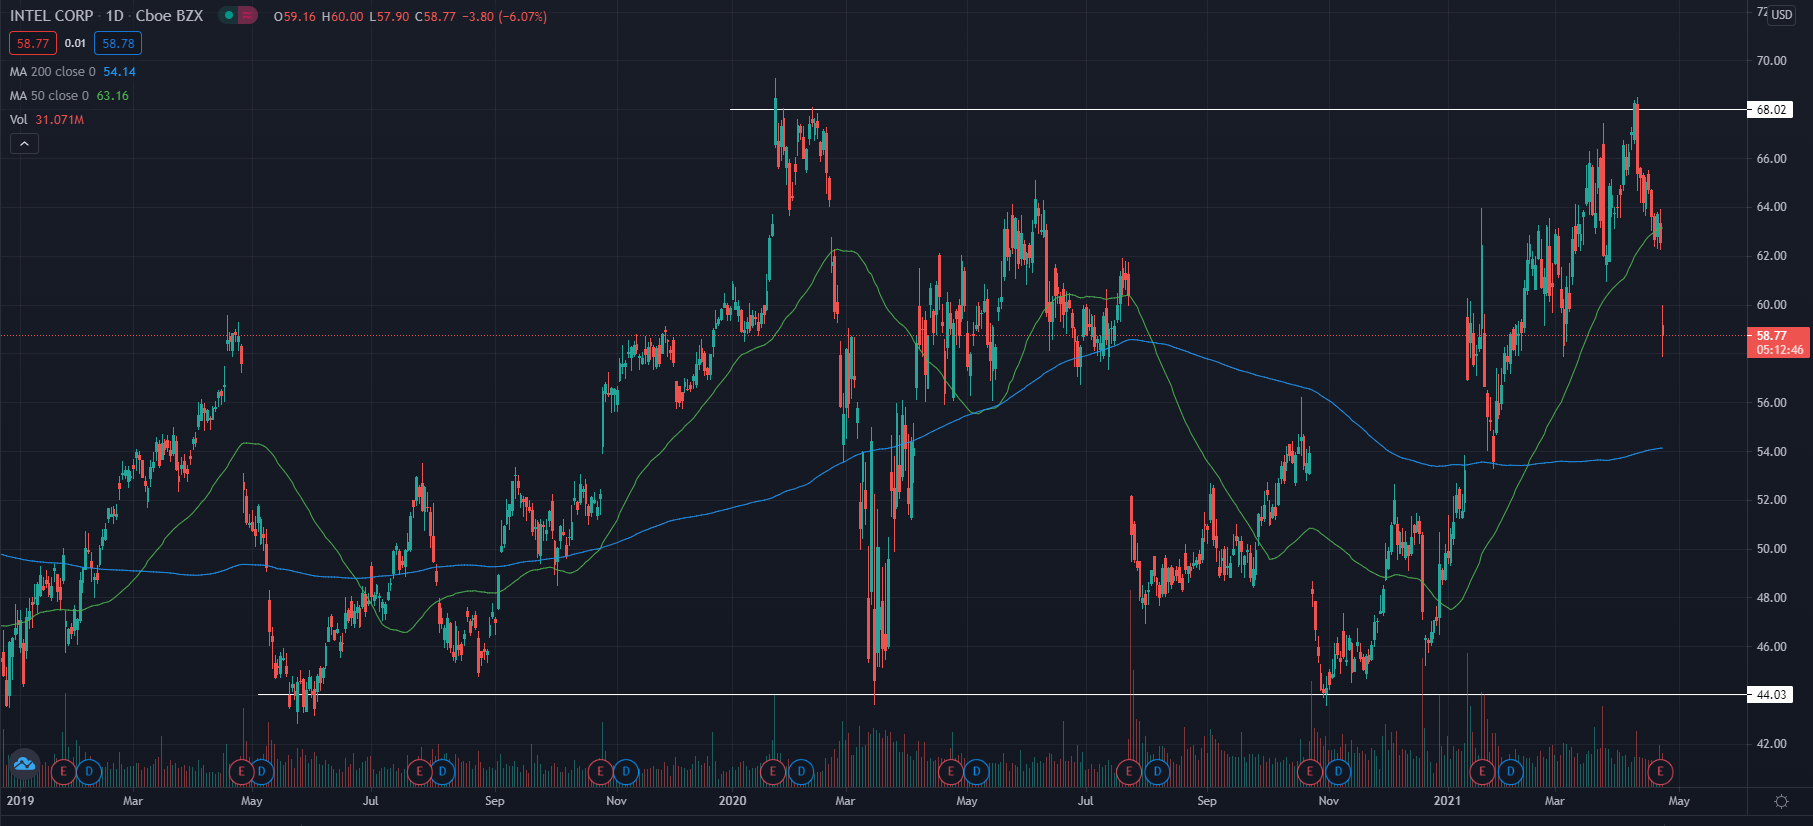
Intel Daily Chart Analysis
- Intel looks to be trading in a channel and has seen sideways movement throughout the past year.
- The stock is trading below the 50-day moving average (green) and above the 200-day moving average (blue), indicating the stock is most likely facing a period of consolidation.
- The 50-day moving average may hold as a resistance level and the 200-day moving average may hold as support in the future.
Key Intel Stock Levels To Watch
- The stock has been trading sideways throughout the year and is trading in a channel between the price levels of $44 and $68.
- The stock price will most likely not make any sudden movements while trading in the channel until a news catalyst pushes the price.
- If the price is able to cross one of the potential support or resistance lines, then it may see a stronger move in that same direction.
What’s Next For Intel?
Bullish technical traders would like to see the stock find a base and begin to form higher lows. If higher lows can be built and the price can cross above the $68 level with consolidation, the price could see a stronger push to the bullish side.
Bearish technical traders would like to see the stock fall and break below the $44 support line. With some consolidation below this line, the price could see a strong dropoff.
Intel Corp. is the top holding in iShares PHLX Semiconductor ETF (NASDAQ: SOXX) and iShares MSCI USA Value Factor ETF (NASDAQ: VLUE) and a top five holding in ProShares Ultra Semiconductors ETF (NYSE: USD).
Photo courtesy of Intel.
(C) 2021 Benzinga.com. Benzinga does not provide investment advice. All rights reserved.