

Brent and WTI Crude Oil News and Analysis
Somber global outlook appears to restrict oil prices despite cumulative output cutsWTI approaches prior significant level of $67 which has acted as a pivot point beforeBrent crude oil eyes $71.50 as the next level of supportIG client sentiment issues a mixed signal but extreme long positioning eyes more downsideThe analysis in this article makes use of chart patterns and key support and resistance levels. For more information visit our comprehensive education library
Oil Markets Fail to Shake Negative Sentiment as a Well-Established Level of Support Stands in the Way of Extended Sell-off
Oil markets anticipate economic headwinds ahead as bullish momentum fails to appear despite cumulative OPEC production cuts. In fact, oil continues to trade lower ahead of Saudi Arabia’s production cuts (1 million barrels per day) coming into play from next week as central bank heads are expected to warn of further rate hikes to come.
Elevated interest rates have the intended consequence of dampening global demand in order to lower wide-spread price pressures that have taken hold in the aftermath of Russia’s war against Ukraine and previous supply constraints due to Covid lockdowns.
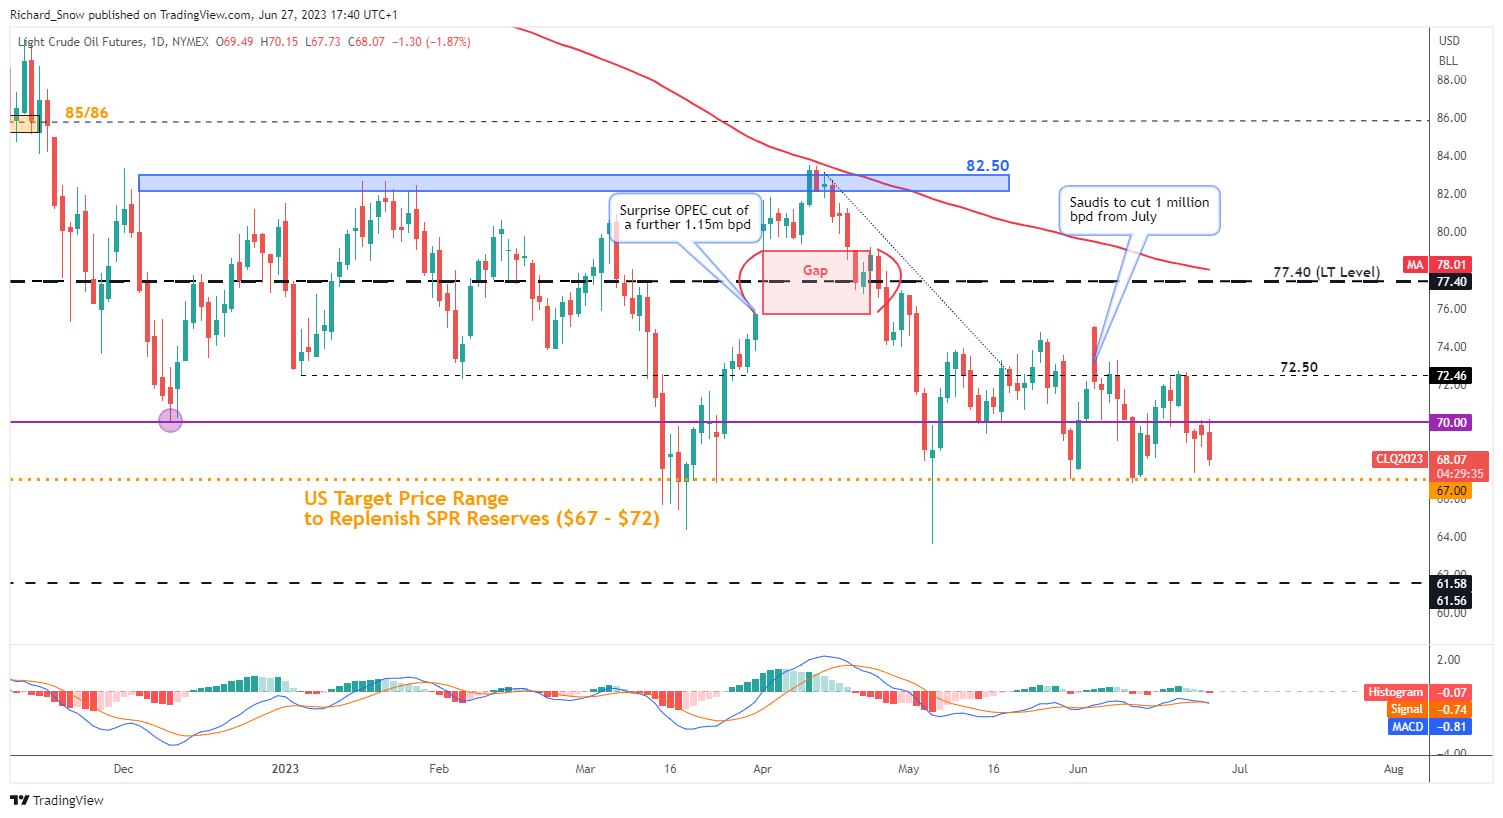
WTI Heads Towards Familiar Pivot Point
WTI (US crude) prices have dropped sharply since tagging the $72.50 handle that provided turning points in January and February of this year. Trading through the psychological level of $70 with relative ease, prices now eye $67 – which was the lower bound of the range identified by the Biden administration as the desired level to replenish reduced SPR levels. This is no longer the case, but the level has continued to act as a pseudo-support for oil prices regardless. A convincing close below this level opens up the market for a potential extended sell-off towards $62. Resistance lies at $70 but the MACD indicator suggests momentum remains to the downside.
WTI Crude Oil Daily Chart
Source: TradingView, prepared by Richard Snow
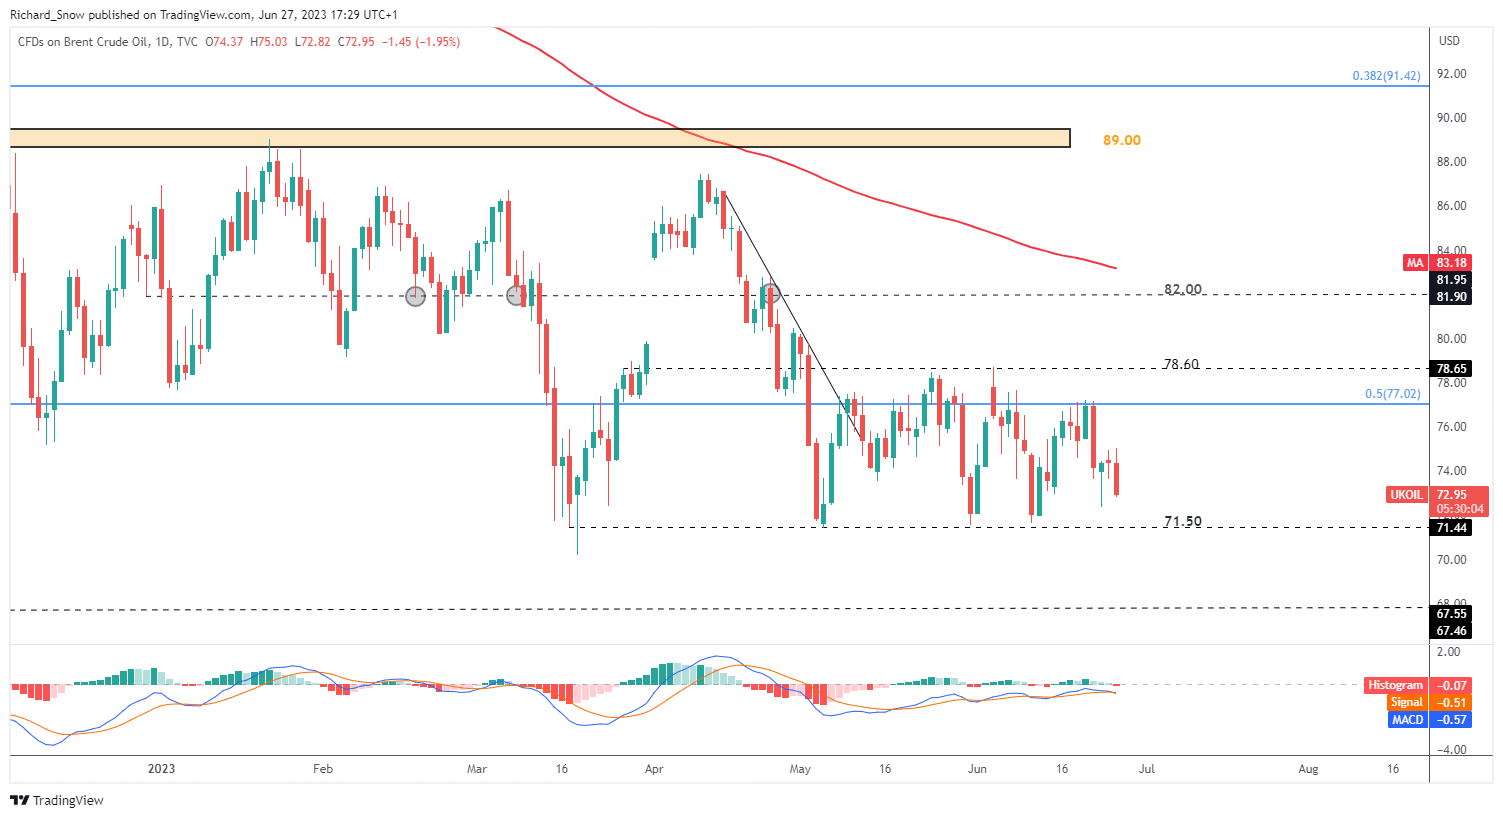
Brent Crude Oil Approaches Test of Extended Sell-off
Looking at Brent crude oil daily chart, a similar marker posture has evolved in recent trading sessions, with a very key level of support in focus. Like WTI, Brent prices have approached a level of support that has thus far halted further selling on a number of occasions and may be tested yet again. $71.50 is the level in focus, with a drop to $67.50 a possibility on further downside momentum. Resistance lies at the 50% retracement of the major 2020 to 2022 advance ($77).
Brent Crude Oil Daily Chart
Source: TradingView, prepared by Richard Snow
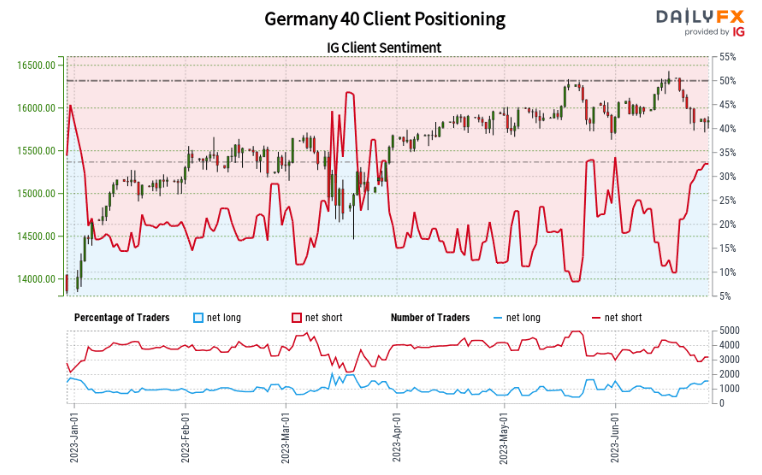
Extreme Net-Short Positioning Poses Potential Challenge for Bearish Continuation
Oil– US Crude:Retail trader data shows 86.96% of traders are net-long with the ratio of traders long to short at 6.67 to 1.
We typically take a contrarian view to crowd sentiment, and the fact traders are net-long suggests Oil– US Crude prices may continue to fall.
The number of traders net-long is 4.78% higher than yesterday and 30.42% higher from last week, while the number of traders net-short is 8.17% higher than yesterday and 25.00% lower from last week.
Positioning is less net-long than yesterday but more net-long from last week. The combination of current sentiment and recent changes gives us a further mixed Oil – USCrude trading outlook.
— Written by Richard Snow for DailyFX.com
Contact and follow Richard on Twitter:@RichardSnowFX


