

Oil (Brent Crude, WTI) Analysis
China crucial to oil demand outlook, data sensitivity expectedBrent crude oil and WTI eas ahead of EIA storage data and Jackson HoleIG client sentiment briefly shifted net long – complicating the outlookThe analysis in this article makes use of chart patterns and key support and resistance levels. For more information visit our comprehensive education library
China Crucial to Oil Demand Outlook, Data Sensitivity Expected
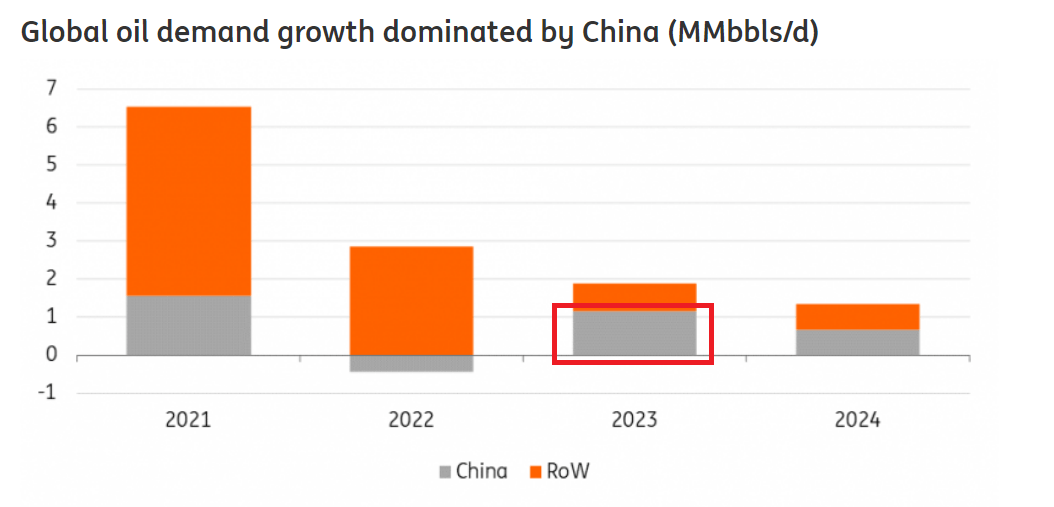
China remains central to the oil outlook for the second half of the year. In fact, China is set to account for 60% of total oil demand growth this year. Therefore, the influence of worsening fundamental data coming out of China is likely to cause some nervousness around, what is currently, a tight oil market. Global oil demand is anticipated to grow by around 1.9 million barrels per day (bpd) to a record 101.8 mbpd.
However, the deteriorating data out of China is yet to have a significant effect on oil prices as markets digest the relative outperformance experienced in the US. Hiking interest rates at record pace was meant to result in increased unemployment and below trend growth. In reality, the US jobs market has eased only slightly while GDP growth has shot up as recently as Q2, with the Fed anticipating another bumper quarter for Q3 (according to data gathered thus far). A tight oil market and improved risk sentiment this week suggest that oil prices may find support at the recent swing low with the potential to head higher.
Global Oil Demand
Source: ING, prepared by Richard Snow
Brent Crude Oil Eases Ahead of EIA Storage Figures, Jackson Hole
The US dollar revealed signs of bullish fatigue and has since turned marginally lower, providing relief and counter-trend pullbacks. However, strong US treasury yields – on the back of strong US data which suggests rates will remain higher for longer – is likely to keep the dollar supported.
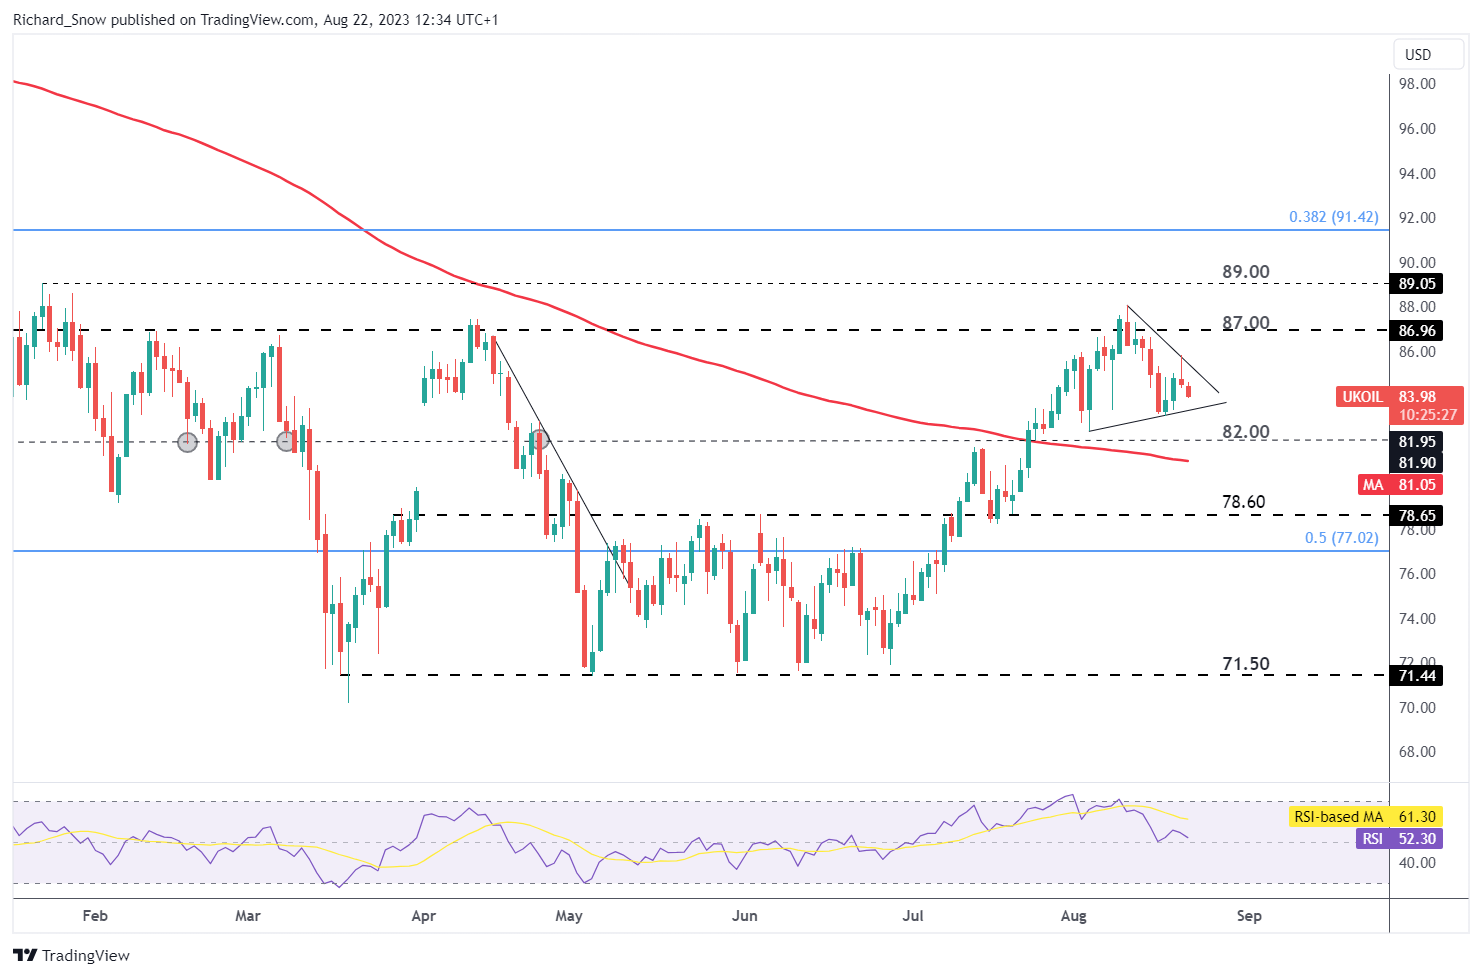
Nevertheless, oil has moved lower, towards the underside of the triangle pattern, potentially eying the swing low around $83 per barrel if the pullback is to continue. Further downside levels of interest emerge at $82 and the 200 day simple moving average (SMA).
A tighter oil market remains the base case despite the negative Chinese sentiment as OPEC+ continue agreed supply cuts while global demand is said to pick up into 2H. Therefore, the longer-term uptrend remains constructive above the 200 SMA, eying $87 and possibly even $89.
Brent Crude Oil Daily Chart
Source: TradingView, prepared by Richard Snow
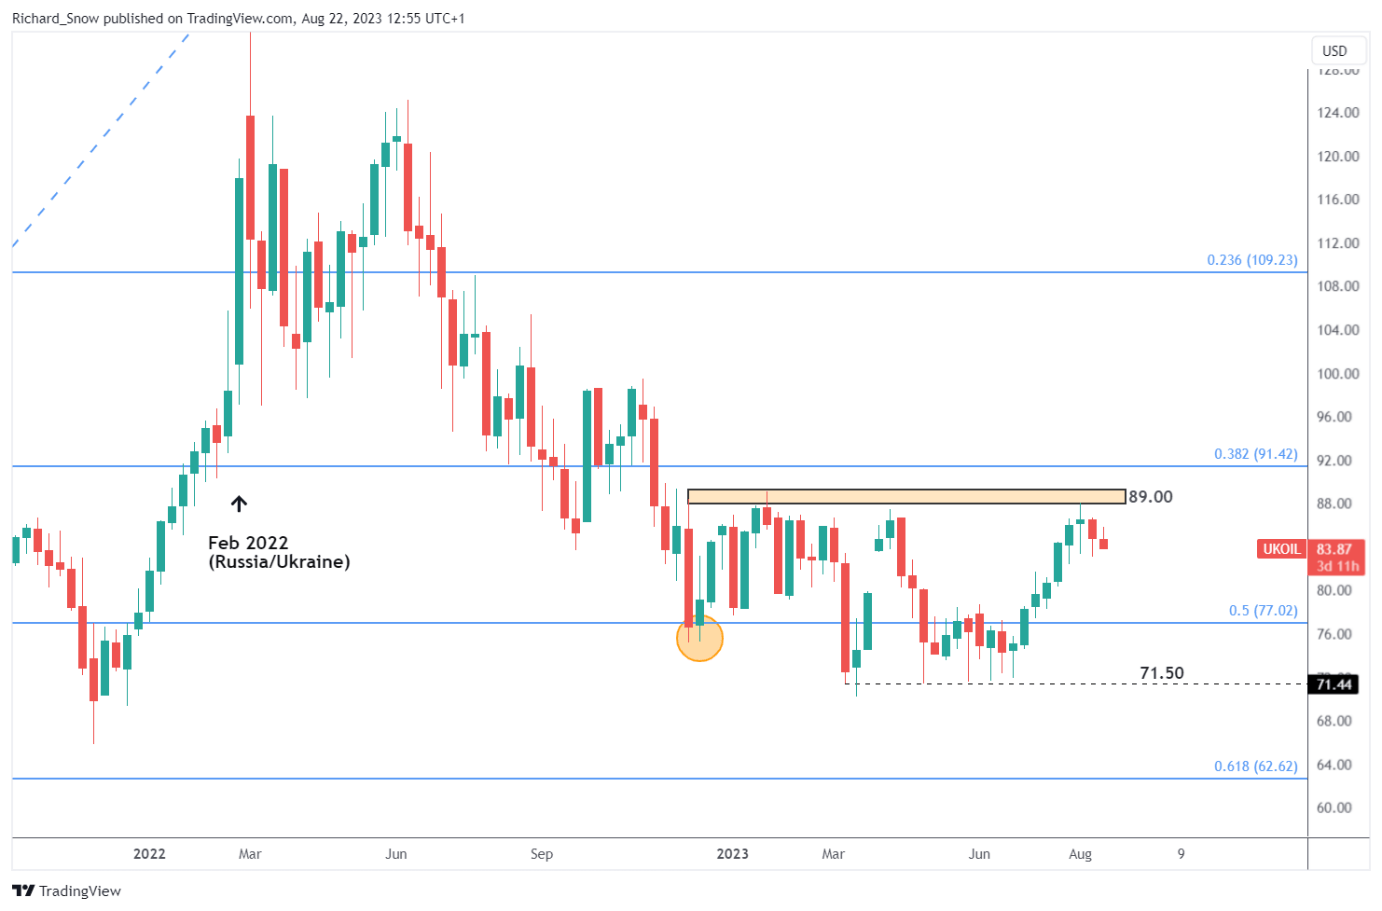
The weekly oil chart shows the zoomed out picture of oil prices over time, which can be seen rising but remaining within that broad range of $71.50 to $89. A rejection of $89 sees prices edging lower for now.
Brent Crude Oil Weekly Chart
Source: TradingView, prepared by Richard Snow
The WTI daily chart below provides a timeline of crucial levels to note as well as supply side revelations from OPEC that have had an instrumental effect on price discovery. The most bullish advance was spurred by additional, voluntary cuts to production from Saudi Arabia in an attempt to raise the price of the commodity.
The swing low followed by $77.40 remain key to bearish momentum, not to mention the 200 SMA narrowly below that. $82.50 and the general uptrend remain constructive provided the pullback moderates before crossing beneath the 200 SMA.
WTI Daily Chart
Source: TradingView, prepared by Richard Snow
IG Client Sentiment Briefly Shifted Net-Long – Complicating the Outlook
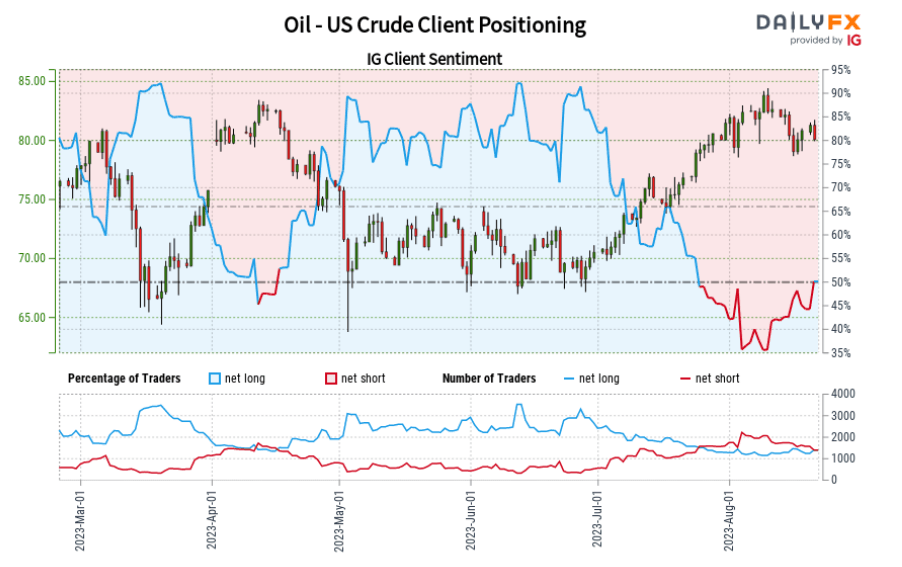
IG client sentiment is mostly drawn upon in times of significant one-sided positioning during strong trending markets. Sentiment hovers around 50/50, lessening its usefulness for trend analysis.
IG Client Sentiment WTI Oil (US Crude)
Source: DailyFX/IG, prepared by Richard Snow
Oil– US Crude: Retail trader data shows 49.26% of traders are net-long with the ratio of traders short to long at 1.03 to 1. We typically take a contrarian view to crowd sentiment, and the fact traders are net-short suggestsOil– US Crude prices may continue to rise however, changes in daily and weekly positioning ought to be considered in the analysis process.
For more on how to read this contrarian indicator, read our dedicated guide to the topic below:
— Written by Richard Snow for DailyFX.com
Contact and follow Richard on Twitter:@RichardSnowFX


