

Multi-Asset Analysis (Gold, Silver, S&P 500)
Gold overheats, lets off some steam at the start of the weekSilver drops after testing resistance zoneS&P 500 gaps higher but looks to tech earnings for bullish catalystThe analysis in this article makes use of chart patterns and key support and resistance levels. For more information visit our comprehensive education library
Gold Overheats, Lets off Some Steam at the Start of the Week
This week has started in a similar fashion to how we closed out last week, with a pick up in risk appetite as the tit-for-tat exchanges between Israel and Iran appears to have come to an end.
Numerous markets breathe a sigh of relief, such as: gold, silver, AUD and US equities. The Aussie dollar often moves in line with risk assets and revealed a partial recovery since Friday afternoon, extending into today. For a more in-depth analysis, read the full AUD report.
Until Friday, gold rode the bullish momentum higher, spurred on by additional safe haven appeal. That same appeal appears to have subsided at the start of this week, with the precious metal on track for the largest single day decline since the 9th of March 2022.
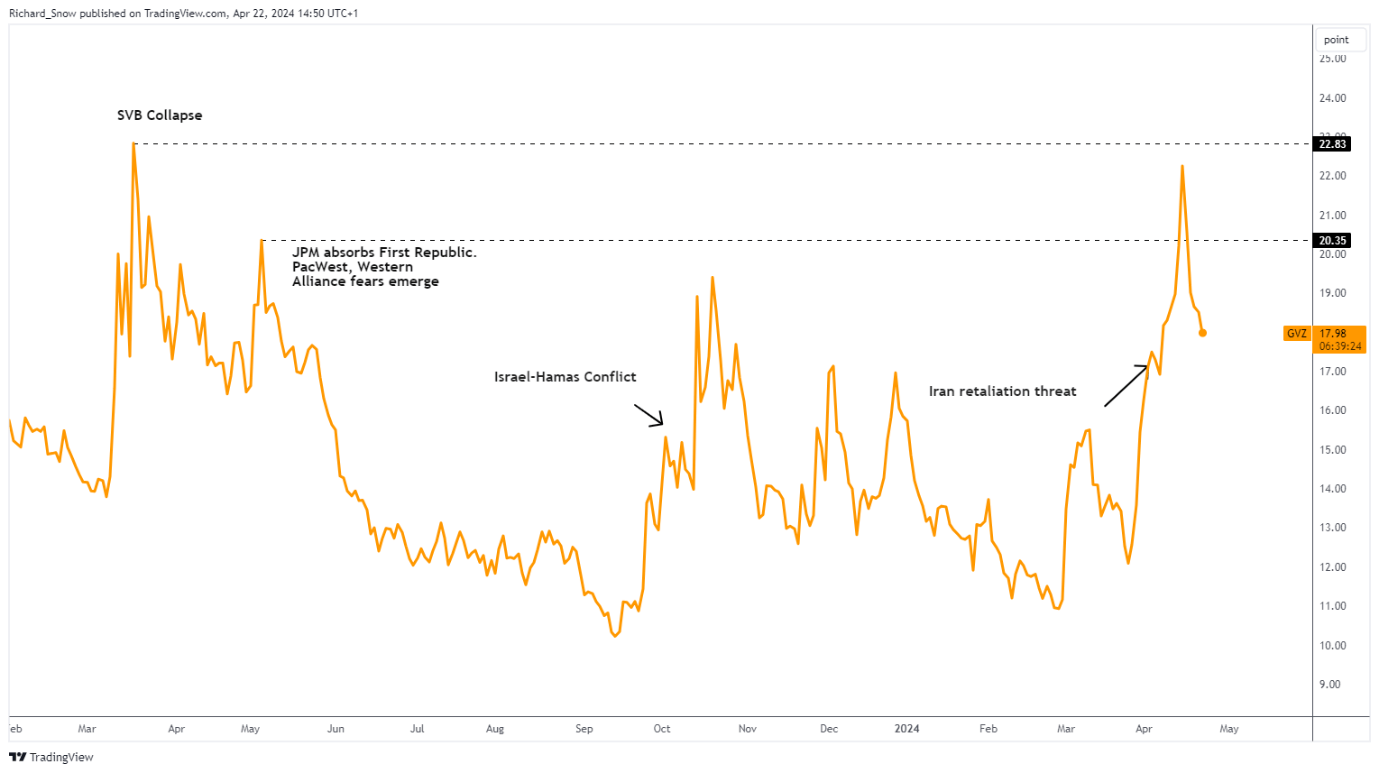
Implied gold volatility has also turned notably lower as markets reduce the likelihood of a broader conflict in the Middle East.
30-Day Implied Gold Volatility (GVZ)
Source: TradingView, prepared by Richard Snow
Gold market trading involves a thorough understanding of the fundamental factors that determine prices like demand and supply, as well as the effect of geopolitical tensions and war. Find out how what lies ahead by reading our comprehensive Gold Q2 forecast :
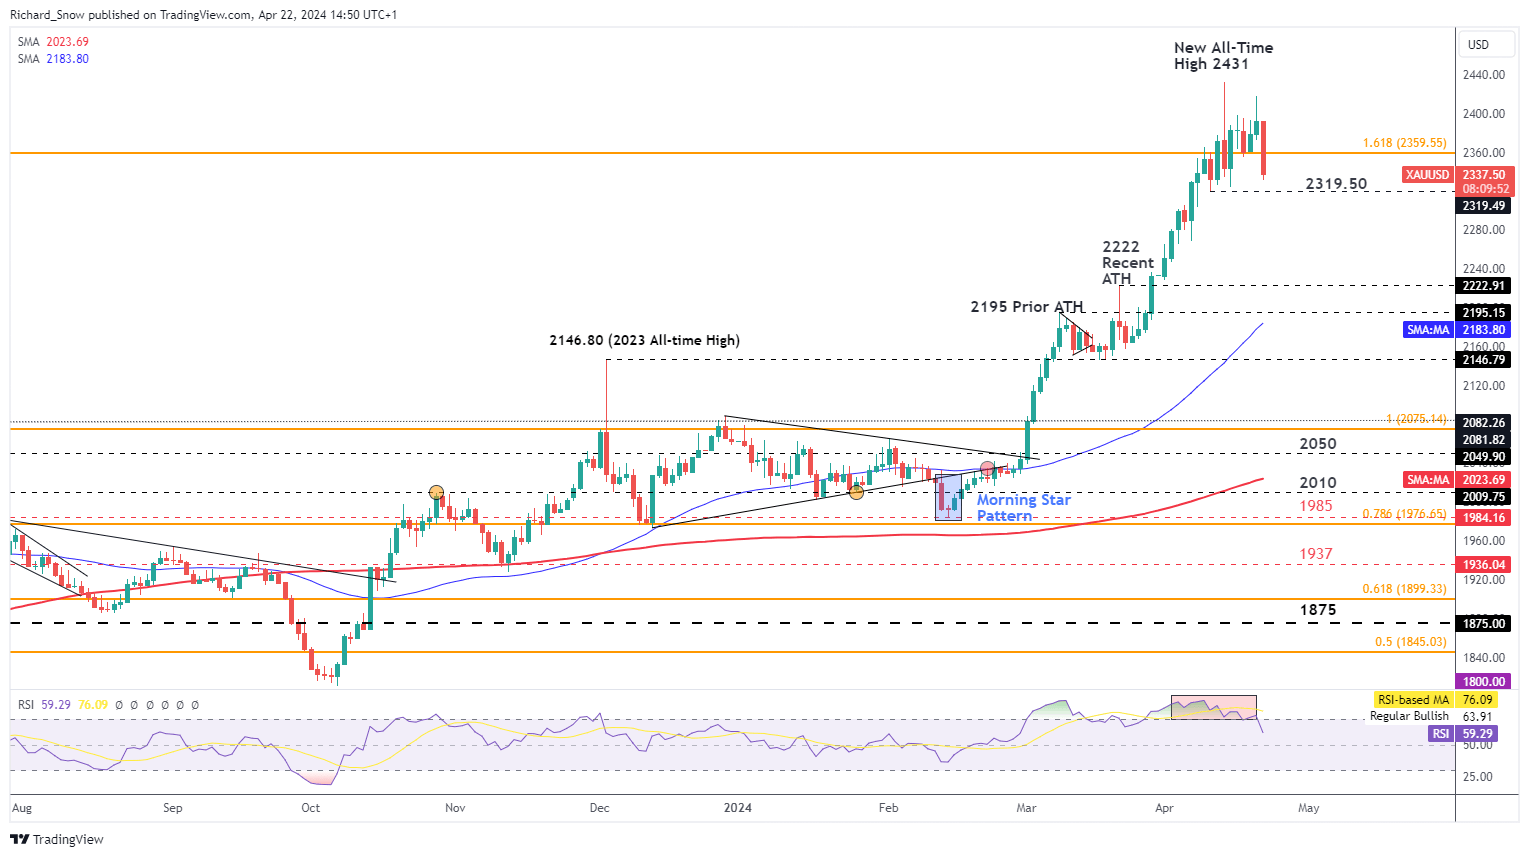
Gold has struggled to approach the new all-time high around $2341, apart from the Friday push, and has traded sharply lower on Monday. The next level of support for the yellow metal appears at $2319.50 ($2320), which could indicate a deeper pullback towards $2222.
Gold has been trading within overbought territory for an extended period of time and has finally recovered into a more ‘normal’ range. Gold has proven to be impervious to a stronger US dollar as well as US Treasury yields, but now that risk appetite appears to have lifted, will the non-yielding metal begin to feel the effects. Additionally, robust US data has led the market to push out rate cuts later in the year, something that is likely to keep the greenback supported, weighing on gold.
Gold (XAU/USD) Daily Chart
Source: TradingView, prepared by Richard Snow
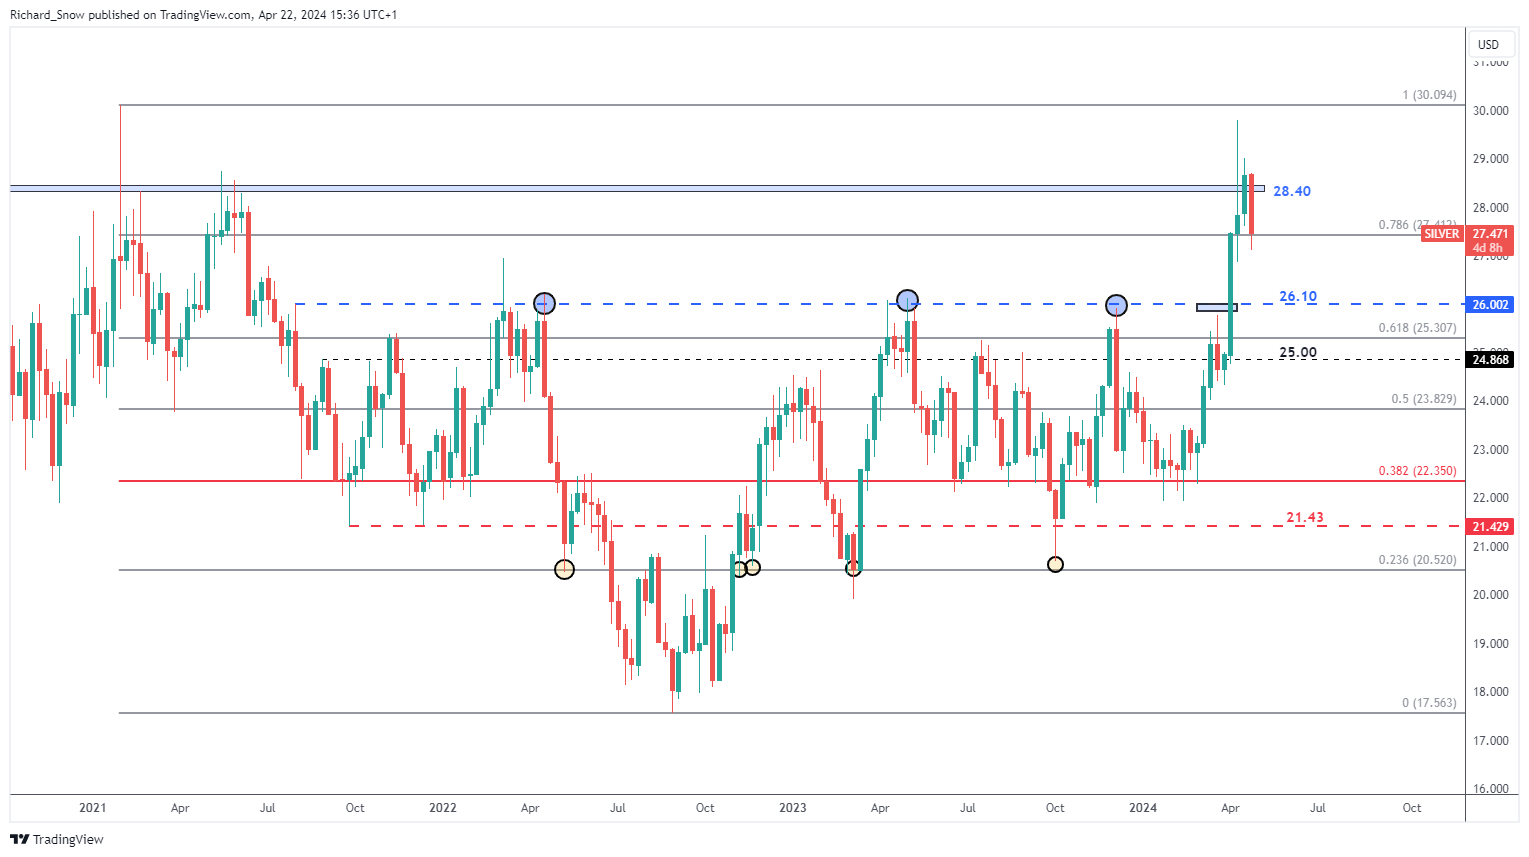
Similarly, silver has seen a notable decline on Monday. As a result, the move can even be seen on the weekly chart and it’s only the first day of the week. Silver prices have found resistance around the zone of resistance at $28.40, now trading below the 78.6% Fibonacci retracement of the 2021-2022 major decline. Further bearish momentum would highlight the $26.10 level which previously acted as a robust level of resistance, followed by the 61.8% Fibonacci retracement at $25.30.
Silver (XAG/USD) Weekly Chart
Source: TradingView, prepared by Richard Snow
Looking for actionable trading ideas? Download our top trading opportunities guide packed with insightful tips for the second quarter!
S&P 500 Gaps Higher but Looks to Tech Earnings for a Bullish Catalyst
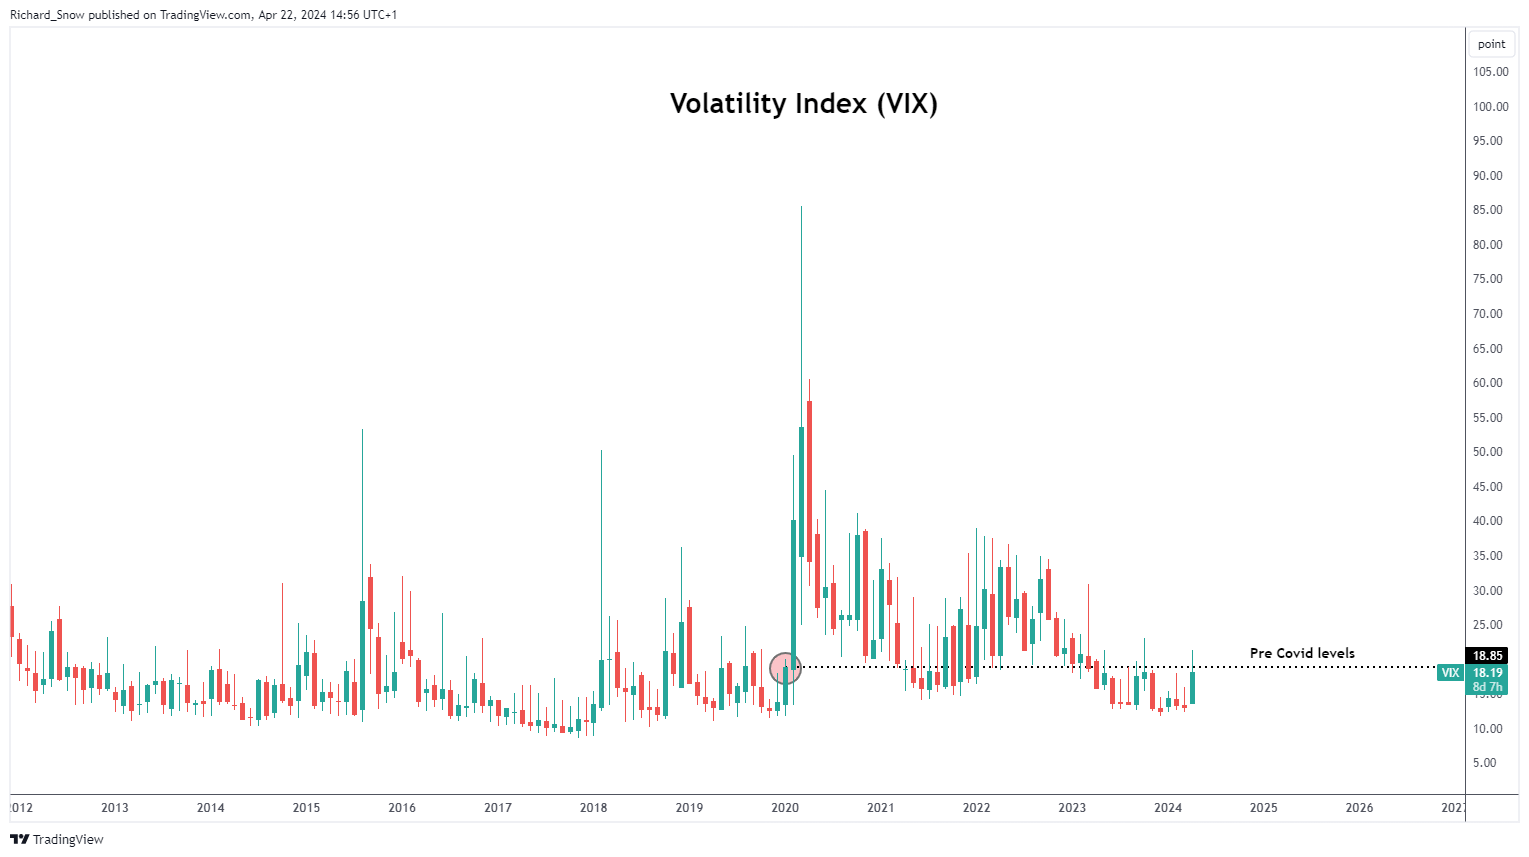
The volatility index (VIX), in the grander scheme of things, has hardly lifted from basement levels when viewed on a large time frame (monthly chart below). The VIX is widely viewed as a fear index, rising when equity markets sell-off. The VIX is already heading lower despite the S&P 500 registering its deepest pullback since the start of the end of October last year.
Earnings season is hitting its stride in the US, with major tech stocks due to post earnings updates this week. Some of those big names include Tesla, Meta, Alphabet and Microsoft.
Volatility Index (VIX): 30-Day Implied Volatility Derived from the S&P 500
Source: TradingView, prepared by Richard Snow
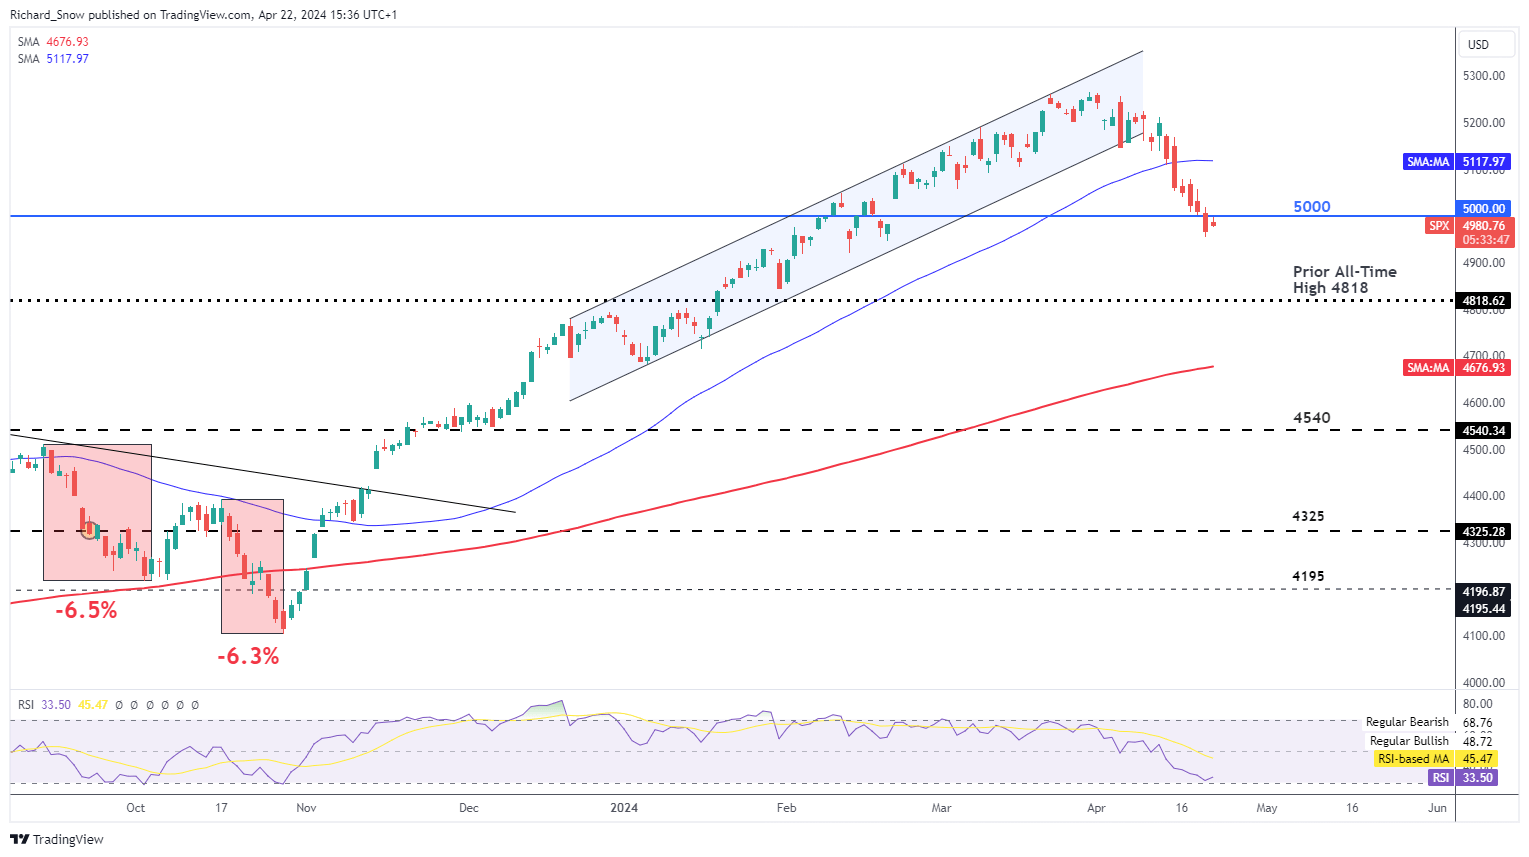
The S&P 500 has retraced more than 5% from its peak but gapped higher at the open on Monday to trade just shy of the psychological 5000 mark. A hawkish admission from the Fed’s John Williams and still robust US data has delayed Fed rate cuts. In fact, Williams put a potential hike on the list of probabilities when addressing the recent uptick in inflation since the start of the year.
A large part of the bull run was fueled by the broad anticipation of multiple rate cuts in 2024, but the landscape looks very different now with markets not even pricing in two full rate cuts from the Fed. The Fed also prefers to stress their independence from politics and steers clear of rate adjustments during presidential elections – meaning realistic opportunities to cut rates are becoming fewer. AI-focused stocks like Microsoft will be under the microscope this earnings season as the AI story was an integral part of the bullish run. Positive earnings reports combined with optimistic forward guidance may be required to re-invigorate US stocks towards the 50-day SMA, while a further decline brings the prior all-time high of 4818 into focus.
S&P 500 Daily Chart
Source: TradingView, prepared by Richard Snow
Stay up to date with the latest breaking news and themes driving the market by signing up to the DailyFX weekly newsletter
— Written by Richard Snow for DailyFX.com
Contact and follow Richard on Twitter:@RichardSnowFX

